- Login
- Home
- About the Initiative
-
Curricular Resources
- Topical Index of Curriculum Units
- View Topical Index of Curriculum Units
- Search Curricular Resources
- View Volumes of Curriculum Units from National Seminars
- Find Curriculum Units Written in Seminars Led by Yale Faculty
- Find Curriculum Units Written by Teachers in National Seminars
- Browse Curriculum Units Developed in Teachers Institutes
- On Common Ground
- Publications
- League of Institutes
- Video Programs
- Contact
Have a suggestion to improve this page?
To leave a general comment about our Web site, please click here
Dimensional Analysis: A Mathematics Tool to Dissect the Circulatory System
byRichard Cordia TaylorRationale and Introduction
My friend Eric told me, "I've been on this great diet. I started off at 220 pounds, ate nothing but hamburgers, fries, and milkshakes for a month, and now I'm down to 120 kilograms."
Joking aside, in December 1998 NASA launched the $125 million Mars Climate Orbiter. Nine months and 416 million miles later, NASA lost that spacecraft because the navigation team trying to insert the craft into orbit was making calculations in meters and kilograms while the computer guiding the operation had been programmed in feet and pounds. 1 Some of the smartest people in the world were undone by a mistake a fourteen year old could have corrected.
Units matter. Units make numbers make sense.
My unit will explore the use of dimensional analysis, the process of using units properly in calculations. Dimensional analysis lends itself to nearly every type of real word situation where math is used because numbers are associated with the measure of quantity in nearly all real world problems.
When students work on word problems, they frequently write down only the numbers without the units that describe what the number measures. The failure to write units removes meaning from the problems, with the result that students frequently put the numbers together using one of the four basic operations without any regard to whether their calculation makes sense. This technique is rarely successful and students soon learn to hate mathematics word problems of all types. That dislike also spills over to problems with math content in the sciences.
Dimensional analysis requires students to always include the units when they write down a number. The process of dimensional analysis takes advantage of the fact that units interact in a mathematically rational way such that the result of a calculation carries units as well. If the units of a calculation do not match the units that the question sought, the students know that their calculation requires re-examination. Further, knowing the units of the input data and the units of the desired output frequently gives clues on how to solve a problem by suggesting how those inputs might interact with each other mathematically in a calculation.
I will use the human circulatory system as the source of problems to investigate with dimensional analysis with an eye towards the development of artificial replacement organs. However, the techniques demonstrated can also be used to attack any type of word problem that involves numbers that carry units. I also introduce a technique of using units without numbers that students can use to pre-screen data for informative relationships between input variables before performing detailed calculations.
Content Objectives
By the conclusion of this unit, students will be able to explain the basic functions of the circulatory system and its primary components. Students will be able to explain various ways that components within the system can fail. Students will also be able to take data in graphical, table, or written form and use dimensional analysis and mathematics to either calculate new data or to frame the data in ways to make it more accessible. For their final project, students will be able to apply this data handling skill either to evaluate a mode of failure within the circulatory system, to evaluate an artificial replacement for some part of the circulatory system, or to evaluate a technology that might be used to develop such replacements.
Overview of the Circulatory System
Blood supplies every cell in the body with oxygen and nutrients and removes waste products that could harm those cells. The heart circulates blood via a system of connected tubes called arteries, capillaries, and veins, which distributes the blood throughout the body. The following sections rely heavily on the text of Medical Physiology by Boron and Boulpaep, 2 although the information is of a general nature that should be consistent with any biology text that deals with the circulatory system. Similar material is also available on internet websites. 3
Overview of the Heart
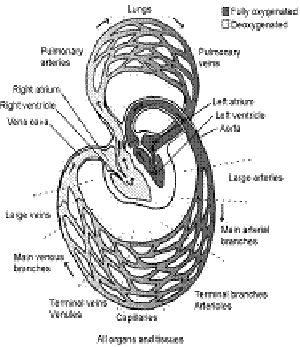
Figure 1 Overall structure of the circulatory system
Courtesy of W. Mark Saltzman 4
The heart is a set of muscular compartments whose contractions pump blood and a set of one way valves that ensure that blood flows in only one direction. The heart is divided into a right section and a left section and both sides are divided into an upper chamber called the atrium and a lower chamber called the ventricle. The right side of the heart is responsible for the pulmonary circulation between the heart and the lung, while the left side is responsible for the systemic circulation between the heart and the rest of the body. The time period when a chamber of the heart is relaxed is called diastole, and the period when a chamber of the heart contracts is called systole.
In a typical cardiac cycle, deoxygenated blood fills the right atrium from the inferior and superior vena cavae, two large veins that return blood from the body to the heart. Blood begins to flow directly from the right atrium into right ventricle through the tricuspid valve even before the atrium contracts. An electrical signal originating in the right atrium at the sinoatrial node causes the atrium to contract (atrial systole). The contraction forces the remaining blood in the atrium into the right ventricle. As the right ventricle fills with blood, the electrical signal from the heart arrives at the ventricle, causing it to contract (ventricular systole). The ventricular contraction increases pressure in the blood within the chamber, which causes the pulmonary valve to open, and forces blood out of the heart and into the pulmonary artery sending blood to both lungs. Under pressure from the ventricular contraction, the tricuspid valve closes, preventing blood from flowing backwards into the atrium.
Within the lungs, blood absorbs oxygen and releases carbon dioxide. Blood flow from the lungs returns through the pulmonary veins to the left atrium of the heart. The newly oxygenated blood flows into the left atrium and begins to flow through the mitral valve directly into the left ventricle before the atrium contracts. The left atrium contracts (atrial systole), sending the remaining blood into the left ventricle. After the left ventricle fills, it contracts (ventricular systole), pressurizing the blood and pumping it through the aortic valve and out the aorta and into the rest of the body. During ventricular contraction, pressure in the ventricle closes the mitral valve, preventing backflow into the left atrium.
While the process I described above makes it seem like there is a series of four consecutive contractions, in point of fact, both atria contract nearly simultaneously and later both ventricles contract nearly simultaneously. The right side pumps deoxygenated blood to the lungs, while the left side receives and pumps out oxygenated blood coming from the lungs from a previous cardiac cycle.
Overview of Blood Vessels
Oxygen-rich blood—pressurized for transport by the left ventricle—travels to each cell in the body, flowing through a series of blood vessels called arteries that branch (or bifurcate) into smaller vessels called arterioles, which further bifurcate into even smaller vessels called capillaries. The capillaries have extremely thin walls that allow the red blood cells in them to interact with the body's cells. While in capillaries, the red cells release oxygen and nutrients to the somatic cells and simultaneously pick up waste products and carbon dioxide. The blood then begins its trip back to the heart. The capillaries merge into larger vessels called venules, and the venules merge into larger veins. All of the veins merge into the inferior and superior vena cavae that lead back to the heart.
The arterial side of the circulatory system is under pressure, and it is this side of the circulatory system where blood pressure is taken. In the process of bifurcation, the diameter of the vessels decreases exponentially as the number of blood vessels grows exponentially to spread the blood over a greater volume. As the vessels get smaller, both the pressure in them and the velocity of the blood through them decreases. The slow velocity of the blood in the capillaries increases the time for exchange of molecules between the red blood cells and the somatic cells of the body.
When the doctor reads my blood pressure as 130 over 85 (135/85), the first number is the peak diastolic pressure generated by the left ventricle when it contracts. The second number is the systolic pressure, which is the residual pressure that remains in the artery when the left ventricle relaxes. I'll discuss the units of the numbers in these measurements shortly.
The venous side of the circulatory system is not under pressure. Incidental and natural movement of the skeletal muscles squeezes blood through the veins, and a system of valves within the veins prevent back flow.
Dimensional Analysis Calculation Demonstrating Heart Reliability
The heart is a remarkable organ, which makes building a replacement for one an extremely daunting task. Unlike my car that I can stop, turn off, and park in the garage ready to use tomorrow, if my heart stopped beating for the night, I'd be in the morgue. The heart is so reliable that, frankly, I don't think about it most of the time. When my 98 year old grandfather died, his heart finally stopped, yet through his entire life, his heart had functioned literally without missing a beat. Assuming that his heart produced an average of 70 beats per minute, I can see that this works out to about:
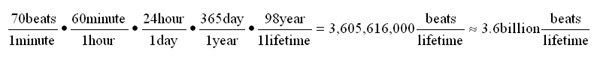
The calculation above illustrates the power of dimensional analysis, and demonstrates how easily I can make some incredibly surprising observations using fairly ordinary information. Dimensional analysis allows me to convert quantities to different units of measure that demonstrate or emphasize particular features of a system—in this case, reliability. Several things are going on simultaneously in the calculation, however, so I will break it down into more digestible pieces.
First, the calculation contains several fractions and the fractions contain units as well. I notice, in particular, that the unit of minute appears in the numerator of one fraction and the unit of minute appears in the denominator of another. These units can be rearranged to yield minute/minute. This fraction can be reduced: minute/minute =1. The result, 1, is now a number without units. I notice also that the equation has several examples of the same situation: hour/hour=1, day/day=1, year/year=1. In the end, the only units left in the calculation are beats/lifetime (beats per lifetime).
Fractions that compare a quantity of one type of unit with a quantity of a different unit are called rates. 5 I assumed that my granddad's heart rate was 70 beats/1 min for the purposes of my calculation. His rate of using his time on earth was 98 years/1 lifetime.
The other fractions in the calculation are a special type called conversion factors. In a conversion factor, the two units in the fraction measure the same type of thing. In the fraction 60 min/1 hr, both minutes and hours measure the same type of thing—time. In the conversion factor, the two quantities measure the same amount of the same thing using two different units. In other words, since 60 min = 1 hr, the fraction 60 min/1 hr really expresses the number 1. As learned in elementary school, when I multiply by the number 1, the value of the other number does not change. Although the value does not change, the number associated with the value and the units used to measure that value do change. Strangely, all of the fractions shown above—in which the numerator and denominator represent the same thing measured in different units—are also equal to 1. This concept can be a little confusing so I'm going to take a look at a simpler example.
A Clarifying Example
I own a yardstick. It is 1 yard long. I notice that the number here is 1 and the unit here is a yard. If I look at the foot measures on the yardstick, I see that it is also 3 feet long. In this interpretation, the number is 3 but the unit is feet. I have the same yardstick, and it's the same length, but if the units used to describe it change, the number associated with the units also changes. This demonstrates that 3 feet = 1 yard, and I can write the conversion factor 3 ft/1 yd, which I can use to convert yards to feet, or another conversion factor 1 yd/3 ft, which I can use to convert feet to yards. I could use my yardstick to make even more conversion factors by noting that the yardstick is also 36 inches long.
Introduction to Units of Measure
For me to understand the circulatory system well enough to entertain the idea of replacing parts of it, I need a way of describing the specifications of the circulatory system and its components so that I know what parameters my replacement parts will need to satisfy. In other words, I have to develop a set of measures that I can use to describe the various processes that take place in moving blood around the body. The following information on base and derived units is adapted from information provided by the National Institute of Standards and Technology. 6
Base Units of Measurement
The first fundamental measurement quantities that I will use are length, time and mass. These quantities are sufficient to describe many physical systems. Since artificial parts may require a power source, I will also discuss the quantities related to describing electrical phenomena.
I introduced several units that I can use to measure length and time in the two prior examples. For my purposes, I will use meters (m) to measure lengths, and seconds (s) to measure time. These units and the mass unit of kilograms (kg) that I will choose below are also members of the International System of Units (SI). If the lengths and times that I encounter are measured in other units, I will usually convert them to meters and seconds. The idea is to translate all calculations about quantities into the same language so that comparing one set of numbers with another can be consistent and clear.
The final fundamental quantity, mass, is one that most people think they have a pretty good understanding of, but mass is actually a tricky concept. Mass is not weight. The pound (lb) is a measure of weight or force, but not a measure of mass. Kilograms (kg) are measures of mass, but not of weight or force. The more mass an object has, the harder it is to move, and if it is already moving, an object with more mass is harder to stop. Mass is also the quality possessed by matter that allows other matter to attract it by gravity. For my purposes, I will simply say that mass is the quality of matter that I can measure in kilograms.
Derived Units
From these three basic quantities of length, time, and mass, I can derive other quantities that I need to describe the function of the circulatory system or any other system for that matter. Derived units often have names of their own to simplify writing expressions. Derived unit names have also become a way for scientists to honor those who have made great contributions to knowledge.
Area is measured in units of length•length. In my chosen SI units, area is measured in meters•meters or meters 2 (m 2). Volume is measured in length•length•length or meters 3 (m 3) in SI. Density is mass/volume or kg/m 3.
An object in motion will travel a certain distance in a certain time. The most fundamental quantity dealing with this motion is called speed. Speed in a particular direction is called velocity. Speed can only be positive or zero. Velocity can be negative or positive or zero based on the conventions of direction within a coordinate system. Speed and velocity both carry the units of length per time (length/time) or, using my chosen measures, meters per second (meters/second or m/s). Other common measures of speed are miles per hour (miles/hour), or feet per second (feet/sec), but if I encounter these, I will usually convert them to SI units.
In some cases, the speed of an object will change. For example, when I step on the accelerator when a light turns green, the car goes from a speed of 0 miles per hour to a speed of 60 miles per hour in maybe 10 seconds. The rate that speed or velocity changes with respect to time is called the acceleration. Acceleration has units of length/time 2, or in SI units, meters per second squared (meters/second 2, m/s 2). Acceleration in the same direction as velocity will speed an object up, while acceleration in the opposite direction of the velocity will slow an object down.
Force is the quantity that can change an object's velocity. My intuitive notion of a force is a push and this is not very far from the scientific notion of force. One of the most famous formulas in science was first stated by Sir Isaac Newton:
F = m•a
This formula states that force is equal to mass times acceleration. From this formula, I can see that force in SI units will be measured in kilograms•meters per second squared (kg•m/s 2). This specific combination of units, kg•m/s 2, is named the Newton (N) in honor of Sir Isaac. The Newton is a derived unit. (Pounds are also a measure of force.) The formula simply says that if you are a given mass and I push you, you will stop standing still and move away from me. If I push you harder with a greater force, then you will move away from me even faster because your acceleration will be larger, which means that your velocity away from me will also be larger.
Pressure is the application of a force over a given area and has the units of force/area. Pressure can be written in standard units as N/m 2 (also called the Pascal (Pa) after the scientist Blaise Pascal) or in basic units as (kg•m/s 2) /m 2 = kg/(m•s 2) in simplified form. To get an idea of what pressure is, consider my friend Amanda walking across a lawn in flipflops. Since the bottom of her heel is fairly wide and has a large area, she does not sink into the soil. If Amanda walks across the same lawn in 6 inch stiletto high heels, however, she will find herself immediately stuck with five of those inches of heel in the ground. The difference is that the point of her high heel has a much smaller area than the area of the heel of the flipflops. In both cases, the force applied is just Amanda's weight, but in the case of the pointed high heel, the area is maybe 100 times smaller. This means that force is divided by a much smaller number which creates a pressure that is 100 times greater than the flipflop heel. This greater pressure easily pierces the soil and poor Amanda sinks into the ground.
In the medical context, pressure is most frequently measured in units of millimeters of mercury (mmHg; also called a Torr after Evangelista Torricelli), which seems like a very strange unit and it is. It is important to keep in mind that the unit is the whole thing "mmHg." As a unit, mmHg has nothing to do with a length and will not reduce out mm in a calculation. The unit mmHg can only reduce out mmHg. This particular unit is the result of the historical circumstances of the invention of the barometer, the weight of air, and the fact that mercury is the heaviest known liquid at room temperature. The conversion factor I need to convert the Torr unit to my chosen ones (SI) is about 133.32 Pa/Torr. This means that my blood pressure of 130 over 85 mmHg would be 17,332 Pa over 11,332 Pa, which might explain why doctors keep using the traditional units. In fact, one important purpose of having different units to measure things is to help express physical phenomena in numbers that are easy to remember (i.e. 130 over 85 is easier to remember than 17,300 over 11,300).
Energy is a measure of the ability of a system to do work. Energy can come in a variety of forms, but is always measured in units of mass•length 2/time 2 or in SI units kg•m 2/s 2. This set of units is also known as a joule (J), after the scientist James Joule. Kinetic energy is the energy associated with motion. For an object of mass, m, with velocity, v, the kinetic energy of the object is
KE = mv 2/2
Applying a force to an object through a distance is called work. Work is a form of energy. As an equation this is written: work=force•distance. The force that Earth's gravity exerts on an object of mass, m, is m•g, where g=9.8 m/s 2. The amount of work that I do to raise an object of mass m, a height, h, is m•g•h. The work that I do to raise my 4 kg cat 1.5 m up is equal to 4 kg•1.5 m•9.8 m/s 2= 58.8 kg•m 2/s 2 = 58.8 joules. Since my cat is now above the ground, she has potential energy. Potential energy can be thought of as stored energy. The amount of potential energy that she has is exactly equal to the amount of work I did to pick her up. If I let go of her, her potential energy transforms into kinetic energy as she accelerates, picks up velocity and drops to the ground.
Power is the rate at which work is done or the rate at which energy is used. I require more power to lift a weight quickly than to lift the weight slowly even though the total work done in both cases is the same. In SI units, power is measured in joules per second (J/s) = watts (W) (after James Watt) or in basic units kg•m 2/s 3. In the case of artificial organs that require active components—those that move or consume energy for other functions—the rate at which energy is consumed has direct implications for how that energy can be supplied to the device.
Base and Derived Units for Electrical Systems
Because there is a high probability that active devices will require electrical power, I also introduce the additional basic unit of electrical current flow, the ampere (A) (after Andre-Marie Ampere). The unit of electric charge is the Coulomb (C) (after Charles-Augustin de Coulomb). A current flow of 1 coulomb/second = 1 ampere. The flow of charges though an electrical circuit is what makes electronic devices work.
The volt (V) (after Alessandro Volta) is the unit of electrical potential. One joule of energy will move 1 coulomb of charge through an electrical potential difference of 1 volt. The volt has units of joules/coulomb (J/C). In an electrical circuit, charge flows through a conductor because of the difference in voltage potential between one end of the conductor and the other. Conductors possess a quality known as resistance, and the resistance of a conductor is measured in ohms (Ω) (After Georg Simon Ohm). A current of 1A will flow through a conductor with a resistance of 1Ω if a potential of 1V is placed across the conductor. Ohm's Law states this as a general equation: V=IR. V is the voltage in volts, I is the current in amps, and R is the resistance in ohms. From Ohm's law I can deduce that the unit for ohms is J•s/C 2.
An important observation is that the product of 1 volt and 1 ampere is equal to 1 watt: 1 V•1 A=1 (J/C)•1 (C/s)=1 J/s=1 W. This will be an important relationship for the analysis of power usage in electrical devices replacing parts of the circulatory system. For the most part, I will not further convert electrical calculations into kilograms, meters, and seconds unless it is absolutely necessary to draw a conclusion.
Dimensional Analysis of Graphical Data: Ventricular Pressure vs. Volume Graph

Figure 2 Left Ventricular Pressure vs. Volume Loop 7
The pressure vs. volume changes that occur in the left ventricle during one cardiac cycle are shown in Figure 2. This graph suggests several interesting questions about the ventricle's engineering characteristics. For context, the graph starts with the light blue arrow where the mitral valve opens allowing blood to flow into the ventricle which is relaxing in diastole. About midway through the dark blue arrow, the left atrium contracts increasing the pressure in the left ventricle slightly and pumping the remainder of its contents into the ventricle. At the green arrow, the ventricle begins contraction with the pressure increasing at a constant volume (i.e. isovolumetrically, since the valves guarding the entrance and exit to the ventricle are both closed). At the magenta arrow, the pressure in the ventricle exceeds the residual pressure in the aorta, the aortic valve opens, and blood is pushed out of the ventricle into the aorta. At the orange arrow, blood continues flowing out of the ventricle until the aortic pressure exceeds the ventricle pressure and the aortic valve closes. At the red arrow, the ventricle begins diastole and experiences isovolumetric relaxation until the pressure falls below the atrial pressure and the mitral valve opens again for another cycle. In addition to the pressure and volume directly shown in the graph, it is clear that the process of moving blood from the ventricle to the aorta requires energy for the heart to do this work.
Analysis 1: Area Enclosed by a Curve
Frequently, the area enclosed by a curve will have significance. Mathematically, the process of finding the area within a curve is the operation of integration. I can approximate the integration suggested by this graph with an estimate of graphical area. Each of the rectangles in the graph has a base that is measured in units of volume and a height that is measured in units of pressure. I can do a pre-analysis of the units that this area represents in the graph by using the SI units for pressure and volume and simplifying.
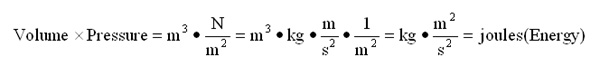
Since the quick dimensional calculation yields an energy unit, a quantity known to have engineering significance, I know that this is a calculation worth making in detail.
Counting boxes and taking into account fractions of boxes, I arrived at a total of about 78 boxes enclosed by the loop of colored arrows in Figure 1. Each box has a base of 10ml and a height of 10 mmHg so that the area of each box is 10 ml•10 mmHg = 100 ml•mmHg.
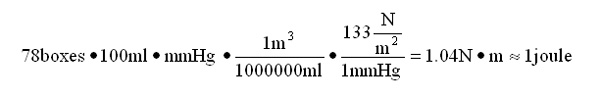
One joule is approximately equivalent to the amount of work I would do lifting a 1 kg mass by 10 cm. If I assume in this case a heart rate of 60 bpm, meaning one cardiac cycle occurring every second, then the left ventricle power output is 1 J/1 sec=1 watt. Taking into account that there are three other chambers of the heart beating, albeit with much less power, I can estimate a total power requirement around 2 watts or less. I could, of course, get a better estimate if I had PV graphs of all of the chambers.
The previous calculation, however, is only the net amount of work that the ventricle does on the blood. The blood entering and leaving the ventricle has a velocity and hence a kinetic energy. The difference between the maximum volume and the minimum volume is the stroke volume of blood pumped in the cycle. I can read this from the graph as 120 ml – 50 ml = 70 ml stroke volume. The blood is ejected from the heart into the aorta with an average velocity of 63 cm/sec. 8 Blood has a density of 1060 kg/m 3 so the kinetic energy of the ejected blood is:
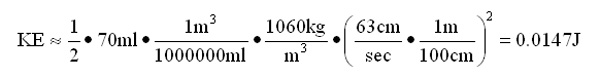
This kinetic energy is considerably smaller than the energy that I calculated for the work done on the blood during the cardiac cycle, and is probably less than the error in calculating that larger energy.
I should point out an important calculation technique that is frequently used when trying to get the big picture of a situation without going into excessive detail before it is needed. Because I used 60 bpm, which I intuitively understand to produce 1 beat/sec, I could do a quick conversion in my head from joules to watts for this choice of parameters. Frequently, when I want a ballpark estimate I will strategically pick input data values to facilitate quick calculation without a calculator. Had I chosen to use my grandfather's assumed heart rate of 70 bpm, I would make the following calculation for cardiac output power explicitly involving dimensional analysis

While this calculation isn't difficult, it is more challenging than the one at 60 bpm. I do note that with the higher heart rate, the power requirements are slightly higher. I also can note the structure of the conversion more clearly here and infer how the output will scale with increased heart rate. For example, with a heart rate of 180 bpm during heavy exercise, I estimate 3W of power to drive the left ventricle since 180 bpm = 3 x 60 bpm. This estimate assumes that the pressure volume loop stays exactly the same under the dramatically different conditions, which is not true, but again I do get a starting point for a more detailed analysis.
Analysis 2: Slope of the Curve
The slope of a curve is also frequently a measure of engineering significance. In the case of the graph in Figure 2, the slope would be measured in units of

The quantity ΔP/ΔV is called the elastance. The reciprocal of the elastance is ΔV/ΔP and is called the compliance. 9 Compliance has SI units of m 4•sec 2/kg. (I note here that the reason that the slope of the graph gave the elastance rather than the compliance is that I chose to graph the volume on the horizontal axis and the pressure on the vertical axis in figure 2. Frequently when scientists study compliance, they plot the pressure on the horizontal axis and the volume on the vertical axis so that the slope of the graph is the compliance. This highlights the importance of noting which axis is which.)
The compliance of a blood vessel is a measure of how flexible (distensible) that blood vessel is in response to an increase in pressure. On the high pressure side of the circulatory system, an artery's ability to flex helps it perform its job better. In fact, as adults age, the compliance of their arteries decreases dramatically. A typical compliance for an adult age 20 to 39 is about 0.75 ml/mmHg compared to a typical compliance for an adult age 60 to79 of about 0.38 ml/mmHg. 1 0 The compliance of arteries is an important characteristic that artificial arteries need to mimic.
I will do a calculation of the compliance shown in the left ventricle during the part of the cycle where the aortic valve opens along the magenta arrow in Figure 2. Using points (V,P) starting at (120,80) and ending at (75,130), I calculate
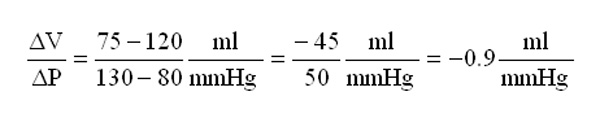
I notice the interesting fact that this calculation gives a negative value for the compliance of the left ventricle during this part of the cardiac cycle as opposed to the positive values of compliance stated for the arteries. This sign difference is a result of what the heart is doing versus what the artery is doing during this part of the cycle. The heart is decreasing its volume while it generates more pressure through contraction. The artery on the other hand is receiving pressurized blood and thus is expanding and increasing its volume in response to the heart pumping.
Dimensional Analysis for Evaluating Potential Power Sources for an Artificial Heart
Since an implanted artificial heart is ideally a portable device, the energy and power will likely be supplied by batteries. A standard AA NiMH rechargeable battery in my camera is rated as 1.2 V at 2500 mA•hr. These battery specifications involve voltage, current, and time. I can do a quick calculation, keeping track of units only, to get V•A•s = (J/C)•(C/s)•s=J, an energy, so this looks like a calculation worth making in detail. The energy in the battery is
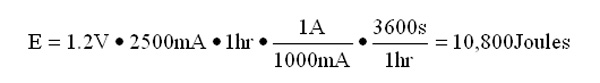
The number seems substantial, but I need to put it in context to see if the camera battery could really be a good potential power source. To build this context, I do another dimensional calculation to determine how long my battery could power an artificial heart using energy at the rate of a natural left ventricle running at 60 bpm.

This calculation tells me that my camera battery is not really a viable power source. I'd need eight of them a day, and that's assuming that there was 100% efficiency in converting the battery energy into pumping work. One-hundred percent efficiency is not realistic. One artificial implantable heart already developed had only 13.5% efficiency and required a 12 W electrical power input to produce a 1.6 W pumping output. 1 1 (The power requirements for this heart seem prohibitive to permanent implantation with battery power.)
There are several important technical aspects of this calculation. First, I stated the battery energy as a ratio with an invented unit to make the meaning of the end calculation more clear. Second, I arranged the conversion factors in a way to make the units I did not want in the end result reduce out of the calculation—sometimes I'll use the conversion factor as given, but sometimes I'll need to use the reciprocal of the conversion factor. Third, I violated my own rule about writing time in seconds because in the context of this evaluation, hours were a more appropriate and clearer unit to express the results of this particular calculation.
Since camera batteries do not provide sufficiently dense energy storage for an artificial heart, are there other sources? Alternative energy sources such as implantable generators driven by skeletal muscles have been explored but theoretically might only produce 100 J/day. 1 2 In the 1970's, nuclear batteries of up to 50 W powered by plutonium-238 were implanted in dogs and primates for periods exceeding a year with few radiation related side effects. 1 3 Nuclear batteries promised decades of continuous operation without recharging or replacing, but plutonium has more dangerous uses, making it difficult to envision these other applications.
Dimensional Analysis does Problem Analysis
Using dimensional analysis as a problem analysis tool involves understanding what type of quantity is involved in a situation (for example, energy or pressure or time) and using the units of the relevant quantities to cast light on how the measured input data might interact mathematically to frame the problem in the relevant units.
Blood pressure measurement is a non-invasive means of assessing the overall health of the circulatory system. I have a blood pressure monitor that measures systolic and diastolic pressure at the wrist from the radial artery rather than on the upper arm. The wrist location allows me to measure my blood pressure in a variety of positions.
I took my blood pressure in three positions: 1) standard arm at the side, 2) wrist raised 30 inches above the standard, and 3) wrist lowered 12 inches below standard.

The data raise many questions, including why the blood pressure measurement changes with my arm in different positions. This tendency for the blood pressure to vary based on position poses another hurdle for the artificial organ developer. At first it might appear that altitude changes blood pressure, but I have had my blood pressure taken on different floors of the hospital without seeing any significant change.
In this problem, dimensional analysis can help me understand these measurements. When I raised my arm 30 inches up from the standard position, I did work on the blood in my wrist. As discussed in the Derived Units section on energy, that blood now has greater potential energy; potential energy was increased by m•g•h, where m is the mass of the blood, g is the acceleration due to gravity, and h = 30 inches is the height I raised the blood. I learned in the left ventricle problem above that pressure•volume is also a form of energy. With these two observations, I now have the height and the pressure expressed in the same language. Compared with the standard position whose energy is P•V, the raised position has both a P•V component and a potential energy component. Assuming that the volume of blood in the radial artery is the same for both systolic measurements, I can write an energy equation.
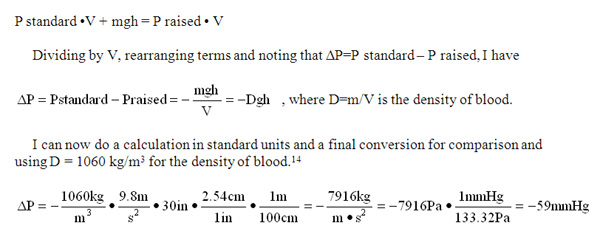
The -59 mmHg calculated is reasonably close to the -50 mmHg measured. The difference between the calculation and the measurement could be caused by my systemic blood pressure changing between measurements, my arteries changing diameter to compensate for the lower pressure, error in the measurement or something else. Nevertheless dimensional analysis leads me to a remarkably simple explanation for the pressure difference that agrees remarkably well with experiment.
Student Background and Challenges
My school's demographic breakdown is approximately 34% Latino, 5% African American, 18% Asian, and 41% Caucasian. The population is split about evenly by gender.
Approximately 54% of entering freshmen take Algebra 1, our lowest math class. The bottom third of the Algebra 1 students are concurrently enrolled in an additional mathematics support class as well. In statewide testing, only 19% of our Algebra 1 students scored proficient. The performance of Algebra 1 students on our statewide testing is a significant factor reducing our school's rating within California. Algebra 1 is also the most flunked class and therefore the most repeated class at our school.
On the other end of the spectrum, 61% of students in pre-calculus and calculus score proficient on the statewide test. Students in the first year Advanced Placement Calculus AB classes routinely outscore the national averages on the Calculus AP/AB exam and have had passing rates (with scores of 3 or above) in the 70% to 90% in the last few years. Students in the second year AP Calculus BC classes routinely have passing rates above 95%.
My target population for this unit is a heterogeneous group consisting of two distinct divisions: A) students enrolled in either first or second year Advanced Placement Calculus, and B) students enrolled in what our district calls Algebra 1 "support" mathematics classes. I will deliberately attempt to leverage the group A students' abilities to improve overall performance of the B group students in mathematics.
Students in the A group are usually from the Junior or Senior class, have above average mathematics ability, have experienced prior success with mathematics, and most likely have already taken a first year Biology class and have taken or are currently enrolled in either or all of the following classes: Advanced Placement Biology, regular Chemistry, regular Physics, Advanced Placement Chemistry, and Advanced Placement Physics. Students in the A group are above average in general academic ability and are all on a college track.
Students in the B group are most likely freshmen or sophomores who have below average mathematics ability as indicated by prior math grades and performance on the California State tests in mathematics. B group students have rarely experienced any level of success with mathematics, and have usually either failed at least one prior mathematics class or have been enrolled in a remedial mathematics class far below grade level in the middle school. B group students are concurrently enrolled with a subject area course of either Algebra 1 or Geometry, and a support class for that subject area to provide extra time and instruction to help bring them to grade level. B group students are behind grade level and sometimes may be as low as first grade level in mathematics (i.e. They have not mastered times tables, single digit addition with a carry, basic fraction operations, etc.). The lowest level mathematics class our district offers for non-special education students is Algebra 1, so the concurrent support class is offered in lieu of providing the students with a remedial mathematics class preceding Algebra. Since our district requires passing both Algebra 1 and Geometry for graduation, B group students are among those most likely to fail to graduate.
Ancillary to the goal of learning the content objectives, the heterogeneous composition of this target group is constructed to improve the affective receptiveness to learning mathematics of the B group Algebra 1 students. In addition to their lack of mathematical ability, the B group students frequently express helplessness and resistance to learning mathematics so that even mathematics that is within their intellectual grasp is not even attempted. No matter how effectively any teacher presents instruction, an unreceptive student will not learn. I chose the content and focus of this unit specifically because it deals with material that is valuable for and accessible to both the A group and B group students.
Strategies
Strategies for this unit will include teacher-directed classroom instruction, student readings, small scale experiments, student group work and collaboration both inside and outside the classroom, classroom question and discussion, and student projects. Student assessment will consist of small repetitive quizzes on important topics like the function and placement of components of the circulatory system. Additional assessment will take place during in class discussion and with a final group project.
Effective lesson construction requires a rational delineation of content objectives, a logical sequence of instruction, a process of ongoing evaluation of student learning during the process, flexibility to adjust to the results of the ongoing evaluation, a means of final evaluation, and finally the often neglected appreciation of the psychology of students and their personal strategies that might work in opposition to the lesson's goals.
Student group work is at the heart of all of the strategies used for this unit. The smallest form of this group work will be a pairing of one student from each of the A and B groups. A two person group forces communication between the members. Larger groups lend themselves to having some members on the outside of a primary subgroup.
If left to their own devices, even in a group of two, one member will tend toward dominance. The disparity of confidence, maturity, knowledge, and academic ability built into these groups will acerbate these tendencies. In fact if left to their own devices, there is a realistic possibility that the A group student would do all of the work with complete acquiescence from the B group student because both might conclude that this strategy would produce the best result to present to a teacher in the shortest time.
To combat this tendency, which might leave the B student learning nothing but how to freeload, I can take a cue from medicine to construct a more effective strategy to foster a fully functioning group. A child born with one weak or wandering eye faces the possibility that his brain will shut off that eye so that the dominant eye can perform its duties without confusing competition from the other eye. While this is nature's optimal short term solution, the child becomes an adult who is blind in one eye and thus lacks depth perception. To fight this natural tendency, a doctor may intentionally weaken the stronger eye by putting a patch over it so that the brain must depend on it and thus must keep it functioning. While patching the strong eye is not optimal for the child's vision in the short run, it does produce a better long term result because the ultimate goal is to have an adult where both eyes work in concert. Following this idea, I want to structure the group to weaken the A group member's participation in order to keep the B group member functioning.
One strategy in this vein that I will use is to value the response of the B group members higher than that of the A group members. I will make students aware of this procedure. For example, when I pose a question to the group, if an A group member answers correctly, it is worth one point, but if the B group member answers correctly, it is worth five points. With this structure, the A group member may know the material, but will have an incentive to teach the B group member ahead of time, because it is more valuable to the group's grade.
Group work will also be the strategy for teaching this class insofar as there will be a teacher of the B group students who will work with me, the Calculus teacher, to present this unit. As classes are constructed, the two target groups would not normally be together. To facilitate this mixing, students from a support teacher whose classes meet at the same time would come to my Calculus class. This requires that I teach the co-teacher the substance of the unit so that he or she can add value as well in teaching the unit to the students.
Because I am teaching mathematics, the general class curriculum does not support the scientific inquiry and instruction necessary for the unit without laying some specific groundwork. Establishing this foundation will take more time than can be spared directly in class. To gain this additional time, students will do a large portion of their inquiry outside of class. To give students the time that they will need to absorb and comprehend the fruits of their research, the unit will stretch longitudinally with the ten days of actual classroom instruction and discussion spread through the semester, rather than being clustered as two consecutive weeks.
Classroom Activities and Lesson Plans
Lesson Plan 1: Your Pulse Rate
Materials
Wall clock and graph paper.
Objectives
After this lesson, students will be able to take their pulse and see where their pulse rate falls in the range of other students' pulse rates. Students will be able to use conversion factors to extrapolate the data measured to tell how many heartbeats they will have in a day, a month or a year. Students will be able to state quantitatively differences in pulse rate due to differences in physical activity.
Activity
I will show students how to take their pulse. After doing so, members of the class will take their pulse for 1 minute, counting their heartbeats while watching the classroom clock. I will pass around a piece of graph paper where each student will color a square in a grid based on his pulse rate in beats per minute, thus eventually forming a bar graph with the distribution of pulse rates vs. number of students with that pulse rate. I will use this graph to discuss measures of central tendency (mean, median, and mode) and measures of dispersion (range and, qualitatively, standard deviation). I will then repeat this experiment with the students after having them run in place for a minute. I will use this new set of data to explain the adjustments that the heart must make during physical exertion. I will use the differences in the graphs from the two trials to illustrate the range of performance that the heart must accommodate. I will then instruct students on how to calculate the number of beats for a variety of time periods using conversion factors.
Lesson Plan 2: Dimensional Analysis and Conversion Factor Flashcards
Materials
Index Cards or Printouts of Flashcards and scissors to cut them out.
Objectives
After this lesson, students will be able to combine units appropriately to construct other units representing important quantities. Students will also be able to use conversion factors appropriately to convert from one unit of measure to another.
Activity Part 1
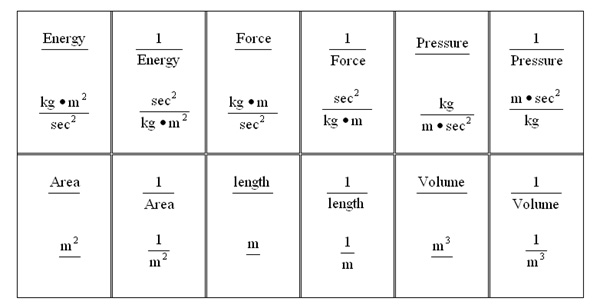
Students will make flashcards with the basic and derived units as shown in the samples below. Students will place the flashcards side by side, indicating multiplication and from this, simplify to find the units of the result. Students will write down the operation shown with units for the quantities used and the resulting units for their answer. When I give students a list of final units, they will find appropriate flashcards to combine to create those units and will record the calculations and the results.
Base and Derived Units Sample Flash Cards
Activity Part 2
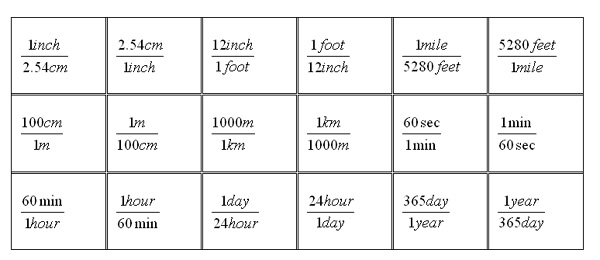
Students will create flashcards of conversion factors similar to those shown below. I will give them a beginning quantity and unit of measure, for example 13 feet and I will ask them to arrange the flashcards appropriately to convert to a target measure, for example, meters. Students will then use a calculator to finish the conversion. Students will write down their calculations including units and the result of their conversion.
Conversion Factor Sample Flashcards
Lesson Plan 3: Reading and Interpreting Slope from a Graph
Materials
A graph of Volume vs. Pressure for a heart chamber or a blood vessel. A straight edge.
Objective
After this lesson, the students will be able to explain what compliance means using appropriate units and will be able to calculate the compliance of a heart chamber or a blood vessel from a Volume vs. Pressure graph (or a Pressure vs. Volume graph). The student will also be able to explain why compliance is an important feature to consider in the development of artificial arteries.
Activity
After discussing with students why compliance is an important feature of blood vessels, I will use a Volume vs. Pressure graph to demonstrate how to calculate the slope of a secant line using the correct units shown on the graph. I will then demonstrate how to use a straight edge to estimate the location and the slope of a tangent line to the curve. I will then ask students to calculate the slopes of secant lines and tangent lines from the graph at different points. Students will then use conversion factors to convert their slopes into SI units.
Lesson Plan 4: Student Project
Materials
Internet and Library access
Objectives
Students will find an area of interest related to the topic of organs or artificial organ development where they can apply dimensional analysis in analyzing data.
Activity
Students will have a great deal of latitude in coming up with their topic for their project. The one characteristic that all of the projects must include is at least three calculations involving dimensional analysis or the use of a conversion factor to interpret data.
Student groups will present their projects both in written form and to the class as a whole orally and visually, and will be graded with a combination of peer grading and my grading with input from the co-teacher. Logistically, several two person groups will form larger super-groups for the purpose of presentation. This organization will save time and provide an additional opportunity for peer teaching within the group structure. I anticipate that A group students will do the bulk of the written work since that is one area where I cannot directly control group members' input. Ideally, however, with the differential evaluation points given that favor B group response, B group students should do the bulk of the oral and visual presentation to provide students with the highest group grade.
Standards Alignment
The goals of my unit are in line with the California Core Curriculum Content Standards for mathematics. 1 4 In these standards, the expectation is that mathematically proficient students will:
Make sense of problems and persevere in solving them.
Reason abstractly and quantitatively.
Construct viable arguments and critique the reasoning of others.
Model with mathematics. Mathematically proficient students can apply the mathematics they know to solve problems arising in everyday life, society, and the workplace. Mathematically proficient students who can apply what they know are comfortable making assumptions and approximations to simplify a complicated situation, realizing that these may need revision later. They are able to identify important quantities in a practical situation and map their relationships using such tools as diagrams, two-way tables, graphs, flowcharts and formulas. They can analyze those relationships mathematically to draw conclusions. They routinely interpret their mathematical results in the context of the situation and reflect on whether the results make sense, possibly improving the model if it has not served its purpose.
Use appropriate tools strategically. Mathematically proficient students consider the available tools when solving a mathematical problem. These tools might include pencil and paper, concrete models, a ruler, a protractor, a calculator, a spreadsheet, a computer algebra system, a statistical package, or dynamic geometry software. Proficient students are sufficiently familiar with tools appropriate for their grade or course to make sound decisions about when each of these tools might be helpful, recognizing both the insight to be gained and their limitations. For example, mathematically proficient high school students analyze graphs of functions and solutions generated using a graphing calculator. They detect possible errors by strategically using estimation and other mathematical knowledge.
Attend to precision. Mathematically proficient students try to communicate precisely to others. They try to use clear definitions in discussion with others and in their own reasoning. They are careful about specifying units of measure, and labeling axes to clarify the correspondence with quantities in a problem. They calculate accurately and efficiently, express numerical answers with a degree of precision appropriate for the problem context. By the time they reach high school they have learned to examine claims and make explicit use of definitions.
Teacher and Student Resources
Bartholet, Jeffery. "Inside the Meat Lab." Scientific American, June 2011.
An article involved with a parallel use of tissue engineering for food production that could provide insights, funding, and economies of scale for the development of critical technologies for tissue engineering.
Cho, Charles Q. "Sugar Within Human Bodies Could Power Future Artificial Organs: Scientific American." Science News, Articles and Information | Scientific American. http://www.scientificamerican.com/article.cfm?id=glucose-body-fuel-cell (accessed August 1, 2011).
A new approach to tiny fuel cells implanted in rats enables the devices to generate electricity for months using sugar in the rodents' bodies.
Kapit, Wynn, Robert I. Macey, and Esmail Meisami. The physiology coloring book . 2nd ed. San Francisco: Benjamin/Cummings, 1999.
An inexpensive and engaging introduction to physiology. Interaction through coloring probably aids recall.
Krumhardt, Barbara, and I. Edward Alcamo. Barron's E-Z anatomy and physiology . Hauppauge, N.Y.: Barron's Educational Series, 2010.
An inexpensive and relatively complete presentation of physiology at an appropriate level.
Nerem, R. M. "Tissue engineering: Confronting the transplantation crisis." pih.sagepub.com. pih.sagepub.com/content/214/1/95.full.pdf (accessed August 1, 2011).
Although old, this is a cogent article delineating the demand for and challenges to tissue engineering solutions to organ transplantation
Endnotes
- 1 NASA, Mars Climate Orbiter Mishap Investigation Board Phase I Report
- 2 Boron and Boulpaep, Medical physiology: a cellular and molecular approach, 508-533
- 3 Cardiology Teaching Package
- 4 Saltzman, Biomedical engineering: bridging medicine and technology, Chapter 8
- 5 American Heritage Dictionary
- 6 Essentials of the SI: Base & derived units
- 7 Boron and Boulpaep, Medical physiology: a cellular and molecular approach, 523
- 8 Saltzman, Biomedical engineering: bridging medicine and technology. Chapter 8
- 9 Boron and Boulpaep, Medical physiology: a cellular and molecular approach, 455
- 10 Ibid, 460
- 11 Wolters Kluwer Health
- 12 Concept Developed for an Implanted Stimulated Muscle-Powered Piezoelectric Generator
- 13 Huffman and Norman, Nuclear-Fueled Circulatory Support Systems IV: Radiologic Perspectives
- 14 California Department of Education, 2-3
Bibliography
Huffman, F. N., and J. C. Norman. "Nuclear-Fueled Circulatory Support Systems IV: Radiologic Perspectives." Cardiovascular Diseases, Bulletin of the Texas Heart Institute 1, no. 5 (1974): 463-476. http://www.ncbi.nlm.nih.gov/pmc/articles/PMC287516/pdf/cardiodis00032-0095.pdf (accessed July 15, 2011).
High wattage nuclear batteries could power artificial hearts for decades
Boron, Walter F., and Emile L. Boulpaep. Medical physiology: a cellular and molecular approach. Updated ed. Philadelphia, Pa.: Elsevier Saunders, 2005.
Good coverage of the cardiorespiratory system (and other physiology as well). Lots of detail and explanation
California Department of Education. "California's Common Core Content Standards for Mathematics." scoe.net. www.scoe.net/castandards/agenda/2010/math_ccs_recommendations.pdf (accessed July 31, 2011).
Core curriculum standards for mathematics are the official guide for what should be taught in a mathematics classroom.
"Cardiology Teaching Package - Practice Learning - Division of Nursing - The University of Nottingham." The University of Nottingham. http://www.nottingham.ac.uk/nursing/practice/resources/cardiology/index.php (accessed July 16, 2011).
An organized set of pages describing cardiac function. Their own note says it all: "This teaching package has been designed for student nurses who know nothing at all about Cardiology."
"Concept Developed for an Implanted Stimulated Muscle-Powered Piezoelectric Generator." NASA - Title.... http://www.grc.nasa.gov/WWW/RT/2004/RP/RPY-lewandowski.html (accessed July 17, 2011).
skeletal muscle generator proposal with theoretical energy yield of 100J/day
"Essentials of the SI: Base & derived units." Physical Measurement Laboratory Homepage. http://physics.nist.gov/cuu/Units/units.html (accessed July 16, 2011).
National Institute of Standards and Technology(for the USA) website
NASA. "Mars Climate Orbiter Mishap Investigation Board Phase I Report." nasa.gov/pub/pao/reports/1999/MCO_report.pdf. ftp://ftp.hq.nasa.gov/pub/pao/reports/1999/MCO_report.pdf (accessed July 21, 2011).
Official NASA report on the loss of the Mars Climate Orbiter due to inconsistency in units used.
Saltzman, W. Mark. Biomedical engineering: bridging medicine and technology. Cambridge: Cambridge University Press, 2009.
the definitive book on Biomedical engineering. Considerable detail and clear explanations. Great questions at the end of each chapter.
The American Heritage Dictionary of the English Language . 4th ed. Boston: Houghton Mifflin Harcourt Publishing Company, 2006.
"Wolters Kluwer Health." LWW Journals - Beginning with A. http://journals.lww.com/asaiojournal/Abstract/2002/09000/One_Piece_Ultracompact_Totally_Implantable.17.aspx (accessed July 16, 2011).
Discusses the power requirements and power output of an artificial heart.
Comments (0)
THANK YOU — your feedback is very important to us! Give Feedback