- Login
- Home
- About the Initiative
-
Curricular Resources
- Topical Index of Curriculum Units
- View Topical Index of Curriculum Units
- Search Curricular Resources
- View Volumes of Curriculum Units from National Seminars
- Find Curriculum Units Written in Seminars Led by Yale Faculty
- Find Curriculum Units Written by Teachers in National Seminars
- Browse Curriculum Units Developed in Teachers Institutes
- On Common Ground
- Publications
- League of Institutes
- Video Programs
- Contact
Have a suggestion to improve this page?
To leave a general comment about our Web site, please click here
Knowing Your Watershed
byCarol BoyntonIntroduction
Wash away your troubles! This advice sounds possible but where do your troubles really go? If you follow the path of the water, you will find that they end up at a stream or river or even spilling into the ocean. It is easy to think that the water will just take things conveniently away, but we mustn't be fooled - those things are still with us. Sadly, many watersheds do have troubles that have washed into their waterways and created a problem for many including plants, animals, and of course, people. This six-week curriculum unit is designed for students in the sixth grade. It guides the young scientists through the steps to understanding the structure of a watershed, investigating human impact, learning about their own watershed, and the designing and building a model of that watershed. Through inquiry and experimentation the students will discover the dynamic operation of their hometown waterways.
As a sixth-grade teacher in a self-contained classroom at Edgewood Magnet School in New Haven, I find the neighborhood/ magnet setting a rewarding environment, with students coming to school each day from a variety of home circumstances and with differences in academic levels. As a result of these variables, the children have a range of background knowledge and life experiences. The classroom is a blend of varied ethnicities, economic strata, and social and emotional strengths and weaknesses. Edgewood provides an arts-integrated curriculum, an educational approach that supports multiple intelligence theory and uses arts education as a means to assist students to improve their academic performance and enrich their lives. Arts-integration curricula use art forms—music, visual art, theater, and dance to teach other core subjects, including math, science, reading, and language arts. This unit aligns with the philosophy of the school. The use of scientific inquiry allows all students at all levels to learn in an inherently differentiated environment.
Rationale
Humans are spending an enormous amount of time indoors. As much as 96% of our day is spent inside so consequently we are experiencing the outdoors less and less. This is an unfortunate and unhealthy trend. Nature deficit disorder, a term coined by Richard Louv in his book, Last Child in the Woods, identifies a result of this extreme amount of time spent indoors. Children are not being exposed to nature on a regular basis and are not making a connection to their natural world. He points out that children who play outside are less likely to get sick, to be stressed or become aggressive, and are more adaptable to life's unpredictable turns. But since his book came out in 2005, things have gotten worse. The average young American now spends practically every minute, except for the time in school, using some sort of electronic device, data reported in 2010, from a Kaiser Family Foundation study.
My students most certainly fall into this statistic. They are connected to the virtual world seemingly more than they are to the real, physical world. Becoming insular has reduced their ability to interact and to appreciate what is truly all around them, their neighborhoods and city. New Haven offers tremendous opportunities for outdoor experiences with its many parks and natural waterways. I want to get my students outside where they can begin to build an emotional connection to their environments, not a wireless one.
Objectives
The New Haven Public School Science Curriculum includes a focus on watersheds in sixth grade. This unit is designed to support that curriculum as well as connect to our arts-integrated curricula. Reading the book One Well, The Story of Water on Earth by Rochelle Strauss, introduces this unit and the content to be explored and experienced. In a clear manner, this text presents to students some fundamental information about our water. Seen from space, our planet looks blue as almost 70 percent of Earth's surface is covered with water, and nearly 70 percent of the human body is comprised of water. Earth is the only planet with liquid water and therefore the only planet that can support life. All water is connected. Every raindrop, lake, underground river and glacier is part of a single global well. Water has the power to change everything: sprout a seed, quench a thirst, provide a habitat, generate energy and sustain life. How we treat the water in the well will affect every species on the planet, now and for years to come. This book can begin to show the students how every one of us has the power to conserve and protect our global well.
This unit guides students through research and activities that help them recognize that they (and others) have an impact on their environment, their living conditions. They will understand that an action that is made in their watershed- the Quinnipiac River - affects the water quality in New Haven, which in turn affects the natural ecosystems that our area should support. Their research on watersheds and topography and experiences experiences outside the classroom provide a foundation to allow them to now construct and "operate" their own watershed model.
Background Information
What is a Watershed?
Every place on the earth is a part of a watershed. Homes, farms, ranches, forests, small towns, big cities and more can make up watersheds. The concept of watershed is an important one because it pertains to everyone. No matter where someone lives, they live in a watershed. A watershed, also referred to as drainage basin or a catchment, is defined as an area of land that intercepts and drains precipitation through a particular river system or group of river systems. In other words, it is a region of interconnected rivers and streams which function as a system for water transport. Watersheds come in all shapes and sizes - some are millions of square miles while others are just a few acres. Some cross county, state, and even international borders. There are many living and non-living things in watersheds. Watersheds are constantly changing.
Watersheds are dynamic and unique places. They are a complex web of natural resources - soil, water, air, plants and animals. Yet, everyday activities can impact these resources, ultimately impacting our well-being and economic livelihood. Healthy watersheds are vital for a healthy environment and economy. Our watersheds provide water for drinking, irrigation and industry. Many people also enjoy lakes and streams for their beauty and for boating, fishing and swimming. Wildlife also needs healthy watersheds for food and shelter. What we do in the watershed has far reaching effects. As more people move into a watershed, more homes are built and more resources used. Human uses of the land change the quality and quantity of water and can affect the species diversity. Non-native plants can begin to invade and outcompete some native species.
A watershed is comprised of the land area that drains into a body of water. An example might be to use a bowl to represent a watershed. The rim of the bowl represents the highest peaks of the mountains surrounding a valley with a river below, the bottom of the bowl. The inner walls of the bowl represent all of the smaller hills and mountains in the valley. Only water that falls on the rim and the inner walls of the bowl will enter the river. All other water that falls outside of the bowl rim and inner walls will flow in another direction, into a different watershed. Water that is polluted anywhere in the watershed, even if it is hundreds of miles away, will eventually flow into the estuary, the tidal mouth of the river or stream. To keep the water in the estuary clean, it is essential for the water in the transport system to also be kept clean, ultimately maintaining a healthy environment for the plants and animals that live there.
Gravity and topography are the two major factors that define a watershed. Gravity is the force of nature that pulls all water downhill. Topography describes the form of the land: the hills, valleys and other features that influence where and how water will flow. After saturating the ground, rain or meltwater trickles downhill and eventually flows into streams. These then merge into rivers that finally flow into the ocean. Gravity and topography help define these channels of water from the tiny to the huge and cause them to join together into stream networks. These water-flow structures frequently resemble the branching pattern of trees or blood vessels.
The benefits and services provided by healthy watersheds are numerous and include reduced vulnerability to invasive species, climate change, and future land use changes. Healthy watersheds with natural land cover and soil resources also provide vast carbon storage capabilities, offsetting greenhouse gas emissions. Healthy watersheds also provide habitat for fish, amphibians, birds, and insects and stream corridors which provide a key connection across the landscape for animals and birds. Aside from the reduced costs of restoring impaired waters, there are many other economic benefits to protecting and conserving healthy watersheds. Healthy watersheds preserve recreation opportunities such as fishing and water-related recreation (e.g. boating) and contribute to tourism (e.g., hiking and birding). Vulnerability to floods, fires, and other natural disasters is minimized, thereby reducing costs to communities.
Human Impact
Pollution is the presence of substances in the air, land, or water that can degrade human health and environmental quality. These substances may come from many sources, but some of the most serious pollution problems are the result of unwanted by-products—commonly called wastes—from human activities.
In the early 1970's, major steps were taken to reduce pollution from human activities, including passage of the Clear Air and Clean Water Acts and establishment of state and federal environmental protection agencies. Many of these efforts were targeted toward large, conspicuous sources of pollution such as factories and municipal sewage systems, and significant progress has been made in reducing pollution from these point sources.
Point source pollution is pollution that comes from a single, identifiable source such as a pipe or smokestack. But many polluting substances do not originate from a single source. Rainwater, for example, may become contaminated as it moves over and through the ground, picking up pollutants from many different sources. This kind of pollution is known as nonpoint source pollution, and now accounts for most of the water pollution in the United States.
Pollutants from nonpoint sources include: fertilizers and pesticides from farms and home landscapes; oil, grease, and toxic fluids from roads, parking areas, leaking underground storage tanks, and improper disposal of used motor vehicle fluids; sediments from poorly managed construction sites, forest lands and stream banks; acid drainage from abandoned mines; and bacteria and nutrients from livestock, pet wastes, and faulty septic tanks. In fact, nonpoint source pollution comes from such a wide variety of human activities that almost everyone contributes to the problem in some way, often without realizing it.
Nonpoint source pollution is a serious problem that costs millions of dollars in lost and damaged resources, degrades environmental quality, and threatens human health. It has been the focus of numerous state, local, and national efforts. The variety of sources and substances that result in nonpoint source pollution often make it difficult to know exactly what actions are needed to reduce or eliminate the problem.
In many cases, the first priorities are to recognize when pollution is taking place, identify the polluting substances, and determine the sources of pollutants. These tasks are part of the mission of National Oceanic and Atmospheric Administration's Center for Coastal Monitoring and Assessment (CCMA). CCMA conducts long-term monitoring of toxic chemicals and environmental conditions at more than 350 sites along the U.S. coasts. Monitoring typically includes measurements of: the concentrations of common pollutants in sediments and the tissues of living organisms; the toxicity of sediments to living organisms; and the abundance and variety of species in bottom communities.
Coastal ecosystems provide communities with food, economic opportunities, recreational resources, and aesthetic enrichment. But despite their importance, these systems are under increasing stress from human activities. More than half of the U.S. population live in coastal areas, and this population continues to grow. Each year, degradation of coastal resources costs millions of dollars. Despite significant progress in reducing pollution from point sources such as discharge from industrial facilities or sewage treatment plants, nearly half of U.S. coastal waters continue to be degraded by rainwater and snowmelt that becomes contaminated as it moves over and through the ground.
The Quinnipiac River
The Quinnipiac River flows 38 miles from its headwaters in Plainville to its mouth in New Haven. The word Quinnipiac is derived from the people of the Algonquin tribes whose members hunted, fished, and traveled along the river for centuries. The term, roughly translated, means "long water land", possibly a reference to river's six-mile-long estuary. As a major river running through south central Connecticut, it links together more than 350,000 people living in diverse municipalities ranging from cities to suburban towns. Historically, the river held an abundant supply of wildlife and fish. Although the oyster industry dominated in the early 1900's, the estuary provided a habitat for other fish and shellfish.
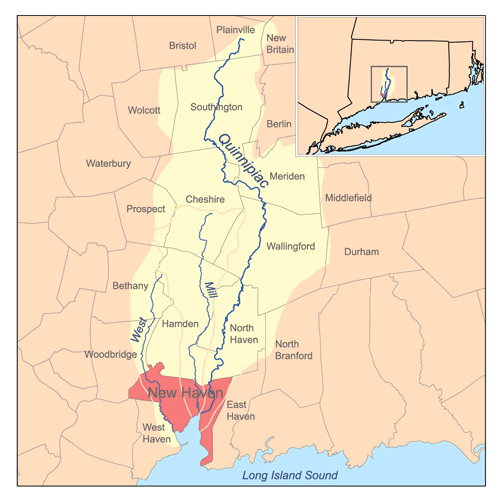
The Quinnipiac River holds an historic place in Connecticut's history as the subject of the first pollution control measure in the state. During the 19th and 20th centuries, the river suffered from severe pollution problems because of the presence of heavy industry and population centers in its watershed. Contamination, occurring from the discharge of raw sewage from the City of Meriden, led to legislation in the late 1800s barring such discharge and ultimately led to the construction of the state's first sewage treatment plant. The pollution problem has improved by the passage of the Connecticut Clean Water Act of 1967, and by the Water Pollution Control Act of 1972, which provided the legal authority to take measures to clean up the river's watershed. The measures included the construction of advanced waste management facilities for sewage and industrial waste.
Teaching Strategies
The approaches for this curriculum unit will vary to reflect the learning styles of all students. Included will be:
Experiential Learning: The major strategy for this unit is to engage the students in hands-on learning. I want them to be actively participating as scientists, not observing a demonstration by the teacher or looking at examples in books. The activities will be designed to be exploratory for the students so they are engaged in the enjoyment of the process as well as the product. A wide range and variety of building and art materials will be included in the exploration and design.
Differentiated Instruction: Lessons and activities will be targeted to maximize learning. The students will use a variety of approaches, working sometimes individually and sometimes in small groups, determined by the complexity of the activity. With the variance in levels and background, guidance and pacing will need to be closely monitored. Groupings, approaches, and support will be aligned with student needs.
Cooperative Learning: The students will be given opportunities to work as cooperative groups to complete assignments and activities. This strategy will allow students to work collaboratively taking on various roles necessary to complete the work, with a focus on success for all. A culminating activity of creating and operating a watershed model will demonstrate comprehension of will include six groups designing and creating a simple machine each and demonstrating its function and advantage to the class.
Classroom Activities
Activity 1 – Water Audit
Students conduct a home water audit and compare and contrast results with and without the implementation of water conservation practices.
Objectives: Students will:
- provide a rationale for implementing home water conservation measures.
- describe the benefits of at least five home water conservation practices.
- recommend water conservation strategies to be implemented within their own homes.
Materials
Water Audit Data Sheet – 2 per student
Activity
1. Organize students into cooperative learning groups.
2. Have each group list all the ways they use water in a 24 hour period inside and outside their homes. Record their ideas on the board.
4. Hand out the Water Audit Data Sheet I. Ask students to review the sheet.
5. Ask them to record on the sheet in Column A by each water use the number of times they believe they conduct that activity in a 24 hour period.
6. Instruct them to record the number of times they and their family actually conduct each water use activity over the next 24 hours in Column B of Water Audit Data Sheet I.
7. Have students compare the number of gallons they predicted with their actual use.
Did they use more water than they guessed? Less? Were students surprised by the amount of water they used?
8. Ask students if they know of any ways to reduce the number of gallons of water they use. Do their parents frequently ask them to turn off the shower? Why? Is water free, just because it flows freely from the faucet?
9. Do students believe that using water resources wisely makes sense?
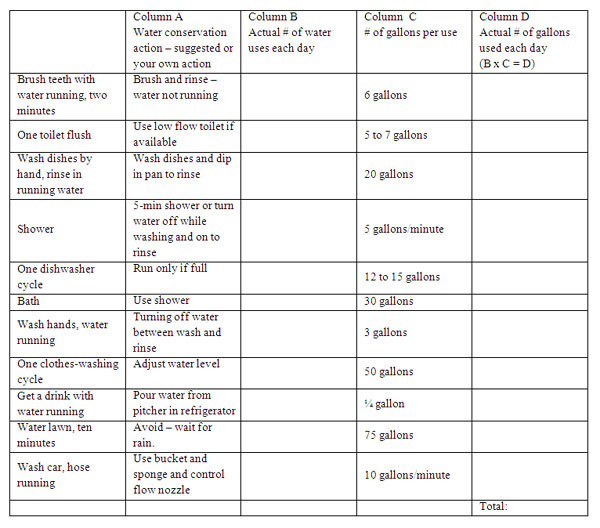
10. Ask students to suggest some water conservation practices. Some ideas have been incorporated in Data Sheet II.
11. Hand out Water Audit Data Sheet II. Ask students to again record the amount of water they and their family use in a 24 hour period, but this time they will implement as many water conservation practices as they can.
12. Ask students to calculate the total amount of water they used in a 24-hour period when they were practicing water conservation measures. Direct students to compare the total number of gallons on Data Sheet I to the total on Data Sheet II.
Wrap Up
Have students respond to the following questions related to water conservation practices:
How did their water consumption change after implementing water conservation measures? How many gallons of water did they save?
Were they more careful about their use of water after they realized how much they used?
Which conservation measures were the easiest to institute? Which practices were the most difficult? Why?
If you were only allowed 30 gallons of water per day, to what water uses would you give the highest priority?
Select three of the water conservation practices that you found fairly easy to use. If you were to apply these three practices routinely, how many gallons of water would you save each month? If every member of your family consistently employed these practices, how many gallons would be saved per month within your own household?
Is it a good idea for a school, business, or hospital to conduct a water audit? Why would a water audit be beneficial for these institutions?
Have students write a set of at least five recommendations or suggestions for their family based on their home water audit. These suggestions should include short and long term actions. For example, for long term actions, students may suggest that low flow showerheads be installed or water saving appliances purchased when the current ones no longer function. They could calculate the savings based upon gallons per minute flow restrictors compared with open lines. They could measure gpm from their faucets by opening the tap fully and measuring the time it takes to fill a quart bottle…Have students share their recommendations with the class.
Activity 2 - Non-point Source Pollution
Background: This activity is designed to demonstrate to students what an average storm drain collects during a rainfall event and how the water from storm drains can impact the water quality and aquatic environments of local streams, rivers, and bays.
Materials:
"Waterway" "Pollutants"
Aquarium Green Food Coloring (pesticides/fertilizer)
Rectangular Box Vegetable Oil (motor oil)
Water Soil/Sand/Pebbles (erosion)
Watering Can Grass Clippings (or Shredded Paper) and Twigs
Spray Bottle Cafeteria Waste and Trash
Preparation: Fill the aquarium half-way with water and place it on an accessible area where it can be easily viewed by the students. Cut a hole in the bottom of the box and place the box on top of the aquarium. The box represents the storm drain and the aquarium represents the waterway that the storm water mixes into after entering the storm drain. Leave the sides of the aquarium uncovered so that the students can view its contents.
Procedure:
1. Introduce this activity with a discussion of storm drains and storm drain systems and their purposes. Discuss where the water and objects that float down into a storm drain go. Have students list all of the things that they can think of that might enter a storm drain during a rain storm.
2. Assign a group of students to each pollutant. Discuss each pollutant, including its use or origin and how it could enter the storm drain.
3. Have each group of students place their pollutant into the storm drain. Use the watering can to create rain to wash the pollutant into the waterway. While washing each pollutant into the waterway, review the pollutant and its use or origin. Discuss the following questions: How does the pollutant damage the environment? Do the people who are responsible for the pollutant want to damage the environment?
Why did they do what they did? How can this type of pollution be stopped?
4. After adding all of the pollutants, examine the contents of the waterway. Discuss how the waterway has changed and how viewing this change makes the students feel.
Follow-up Questions:
1. What types of the pollution are natural?
2. What types of pollution are added by people living in the local communities?
3. How can we remove the pollution from the water?
4. What could be done to stop pollutants from entering storm drains?
Extensions: Have the groups of students responsible for the pollution think of ways to remove the pollution from the aquarium. Try some of the removal methods. Which pollutants were easy to remove? Which were difficult to remove?
Activity 3 – Constructing a Watershed Model
Background
Simple materials are turned into models of wetlands and watersheds in this activity. Students follow the path of the water (and urban runoff) to a lake and develop an initial understanding of what watersheds are. Then some students add sponges to the borders of their lake to simulate wetlands and compare watersheds with wetlands to those without. Students extrapolate the role of watersheds as reservoirs in times of drought, as sponges in times of flood, and as filters for pollution. Finally, students compare watersheds with wetlands to those without after a "toxic chemical spill" (Koolaid drink mix) to see the effects of pollution throughout the watershed as well as to discover the role of wetlands in reducing the harm of severe pollutants to a lake.
Materials
Each team of 3 students needs:
1 plastic tray/container about 8" x 10"
1 kitchen sponge cut into 4 rectangular pieces (the yellow sponges with the green scrubbing material work well for students to observe a color change in the yellow "soil" portion of the sponge while the green material simulates plants living in the wetlands)
1 water spray bottle
a set of water-based markers – various colors
The teacher needs:
a stack of white cardstock paper (each team will use 3 sheets)
1 packet of colored drink mix like Koolaid or Hawaiian Punch
map or satellite image of the school and neighboring areas showing the watershed
Everyone needs:
a copy of the Watershed and Wetlands Questions
a sink to clean sponges and dump dirty water
a trash can
Procedure
Group students into teams of 3 that later pair up into groups of 6
Part 1 – Building a watershed
1) Tell students to imagine that it is raining. Ask the students: "Where does raindrop go after it hits the school building? Where does it go from there? Where does it end up?" They should be able to trace it to a gutter. You may need to prompt them towards naming the rest of the route.
2) Discuss the idea of a watershed. It includes all the land that water flows over and through to get to a larger body of water. Help students imagine what this means in terms of a raindrop that falls in different places in your watershed. Use a map if you want. It is not important that all the kids completely understand the idea right now. The activity that follows should help consolidate the idea for students to experience.
3) Tell the students that they will be building models of watersheds and observing what happens to their models when it "rains". Briefly demonstrate what they will be doing to make their watershed so they can see a nearly finished product before setting the kids loose.
4) Split the class into groups of 3.
5) Students should crumple a sheet of cardstock into a ball then slowly flatten it out again. You should have a piece of paper with many valleys and ridges. Pick one end to be the top; this end will have tall mountains. The other end will be near a lake.
6) First, using markers, add water to your watershed. Have students think about where to put these rivers. Will they be at the tops of ridges or in the valleys? Where might lakes form?
7) Next add natural areas – animals, trees, plants, rocks, sandy banks. Add urban and agricultural areas – houses, cars, schools, farms, gardens, factories, roads, cars. Have students think about where to put various things. Where would you find forests? Where would you find meadows? Where would animals want to live? Where might it be very rocky? Where would people want to build houses? How would they get to their houses? Where would they work and go to school? Where would their food come from? Would you want to build a farm at the top of a mountain? Allow 5-10 minutes for students to finish their watersheds. They should be very colorful.
8) Carefully fit the watershed into the plastic tray so that the mountainside is propped up on the narrow end of the tray (the mountain end) and the land slopes gradually towards the far end of the tray (the lake end), leaving a 2-3 inch gap between the end of the paper and the lake end. Wedge the paper snugly in place leaving as little gap as possible between the sides and the paper.
9) Take one of the markers and prop the mountain end of the tray up a little. This is to make sure that a lake forms on the lake end and does not run back under the land.
10) The 3 students should take turns spraying the paper using the fine mist setting. Spray for 3-5 minutes until there is a decent sized puddle in the lake end.
11) Give students the Watershed and Wetlands Questions handout and give students a few minutes to answer the first set of questions. The questions do not have to be used during class. You could use the questions to being a class discussion or use them as a homework assessment.
12) When students have finished writing their answers, begin a discussion of how this model represents a watershed and how different things affect the watershed. If you still have the diagram of your watershed on the board, you could add these ideas to your diagram. Now is the time to really consolidate the idea of a watershed. Some questions could include:
What path did the rain take through your watershed?
What effect do natural areas have on the watershed? Urban areas? Agricultural areas?
What is "runoff"? Is runoff different in natural versus urban versus agricultural areas? It is important to distinguish erosion from urban runoff.
What affect does runoff have on the lake?
What is a watershed? How is this model similar to a real watershed? How is it different?
Part 2 – Adding Wetlands
13) Tell students that they will now build another watershed. This time, we will compare watersheds with wetlands to those without. Open a discussion of what students think wetlands are. Have they ever seen one? What does it look like? What kinds of plants and animals live there? If they don't know the term wetland, they will likely have heard of a marsh and can bring up a good mental picture.
14) Pair teams up with one another. One team will have a wetland represented by sponges at the border between the land and the lake; the other will do the activity exactly as before (in the third rendition, they will switch roles so that everyone has a wetland once).
15) Clean up the materials and allow groups to create a new watershed with a new sheet of cardstock paper. It should not take as much time this time nor is it necessary for the watersheds to be as elaborate.
16) Set up the trays as before, however, one team should add a tightly packed row of damp sponges to the border between the land and the lake. THE SPONGES MUST BE DAMP. They should not be sopping wet, nor should they be wrung out as much as possible. They should be somewhere in between so that some water could still be wrung out if you tried.
17) Place the watershed with wetlands directly beside the watershed without wetlands and prop up the mountain end with a marker.
18) Allow it to rain an equal amount on each watershed. The students should make an effort to squirt the 2 watersheds an equal number of times. As it rains, encourage them to notice any differences between the 2 watersheds. Stop when a small lake had built up – about 3 minutes.
19) Give students a few minutes to answer the second set of questions. When students have finished writing their answers, begin a discussion of what the role of watersheds might be. Some questions you may want to consider include:
Were there any differences in how quickly each lake filled? What does that mean about what wetlands do in times of heavy rain? Introduce the idea of wetlands as sponges during wet times and reservoirs during dry times to even out the flow of water.
What happened to the color of the bottoms of the sponges? What does this represent?
Introduce the idea of wetlands as filters for pollution.
Part 3 – Toxic Waste
20) Have students hypothesize what might happen to a watershed if a truck carrying pesticides crashed along a highway near a creek. What parts of the watershed might be affected?
21) Students will now have a chance to test their ideas on their models. As before, there will be one team with a wetland and one without, however they should switch roles. A spoonful of pesticide will be added to each watershed before it rains.
22) Clean up the materials and allow groups to create a new watershed with a new sheet of cardstock paper. Set up the trays as before, placing the watershed with wetlands directly beside the watershed without wetlands and prop up the mountain end with a marker.
23) At this point, the teacher should go around and add a teaspoonful of drink mix to the middle of each watershed.
24) Allow it to rain an equal amount on each watershed. Notice any differences between the 2 watersheds. Stop when a small lake had built up – about 3 minutes.
25) Give students a few minutes to answer the final set of questions. When students have finished writing their answers, begin a discussion about the differences between non-point source pollution (runoff) and a pesticide spill. This activity should help illustrate how a single event in one location can affect a very large area and affects all downstream water users including wildlife in the marsh and the lake. Students will observe that while a wetland can soak up some pollution, some will also leak through into the lake. Can it be cleaned up once it gets into the water? Emphasize that although a waste spill is far more dramatic, urban non-point source pollution accounts for the vast majority of the pollution in most watersheds.
26) Given what we've discovered about watersheds and wetlands, what can we do to help them thrive? Have students brainstorm ideas.
Resources
Ahearn, Elizabeth A.. Streamflow in the Quinnipiac River Basin, Connecticut: statistics and trends, 1931-2000. East Hartford, Conn.: U.S. Dept. of the Interior, U.S. Geological Survey ;, 2002.
Andersen, Tom. This fine piece of water: an environmental history of Long Island Sound. New Haven, Conn.: Yale University Press, 2004.
Anisfeld, Shimon C.. Water resources. Washington: Island Press, 2010.
Dobson, Clive and Gregor Gilpin Beck. Watersheds: A Practical Handbook for Healthy Water. Buffalo, NY, Firefly Books, 1999
Louv, Richard. Last child in the woods: saving our children from nature-deficit disorder. Chapel Hill, NC: Algonquin Books of Chapel Hill, 2005.
Moore, Jon A.. Quinnipiac fishes & fisheries: history and modern perspectives on the fishes and fisheries in the Quinnipiac Watershed. New Haven (Conn.): Connecticut Academy of Arts and Sciences, 2001.
Rosenberg, Pamela. Watershed Conservation. Cherry Lake Publishing, 2008.
Wargo, John. Green intelligence: creating environments that protect human health. New Haven, Conn.: Yale University Press, 2009.
Websites
http://www.kff.org/entmedia/mh012010pkg.cfm
The Henry J. Kaiser Foundation Generation M2 study: Media in the Lives of 8- to 18-year olds.
http://www.qrwa.org/default.asp
The Quinnipiac River Watershed Association website.
http://www.ct.gov/dep/site/default.asp
State of Connecticut Department of Energy & Environment Protection
http://ccma.nos.noaa.gov/
http://www.epa.gov/
Appendix 1 – Science Standards
C INQ.1 Identify questions that can be answered through scientific investigation.
C INQ.2 Read, interpret and examine the credibility of scientific claims in different sources of information.
C INQ.3 Design and conduct appropriate types of scientific investigations to answer different questions.
C INQ.4 Identify independent and dependent variables, and those variables that are kept constant, when designing an experiment.
C INQ.5 Use appropriate tools and techniques to make observations and gather data.
C INQ.6 Use mathematical operations to analyze and interpret data.
C INQ.7 Identify and present relationships between variables in appropriate graphs.
C INQ.8 Draw conclusions and identify sources of error.
C INQ.9 Provide explanations to investigated problems or questions.
C INQ.10 Communicate about science in different formats, using relevant science vocabulary, supporting evidence and clear logic.
C 10. Explain the role of septic and sewage systems on the quality of surface and ground water.
C 11. Explain how human activity may impact water resources in Connecticut, such as ponds, rivers and the Long Island Sound ecosystem.
Appendix 2 – Water Audit Data Sheets
Data Sheet 1
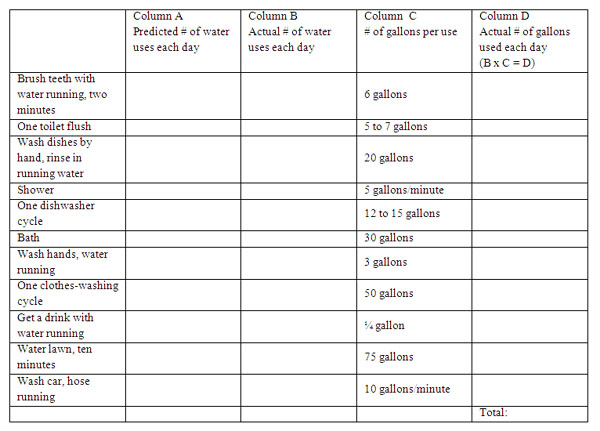
1. Write down any other water uses that are not listed and research to find out how many gallons it takes to perform the activity.
2. Think about how you directly use water every day. Write down how many times you think you conduct an activity each day in Column A.
3. Throughout the day, record how many times you actually do use water.
4. Multiply how many times you use water by the number of gallons it usually requires.
5. Add up all the numbers in Column D to find the total # of gallons of water you use each day.
Data Sheet II
Appendix 3 – Watersheds and Wetlands Questions
Watersheds and Wetlands Questions
Part 1 – Building a watershed
1. Describe the path that the rain took through your watershed.
2. What happened to the drawings that represented natural areas (creeks, trees, plants, animals, wildlife)? What does this represent in nature?
3. What happened to the drawings that represented urban areas (houses, schools, factories, roads, cars)? What does this represent in the real world?
4. What effect did the runoff from natural and urban areas have on the lake that formed at the bottom of the land area?
5. The models we are using are not perfect. What is wrong with our watershed models? How are they different from a watershed in the real world?
Part 2 – Adding wetlands
1. How quickly did the lake with a wetland fill up compared to the lake without wetlands?
2. How much water is the lake with a wetland compared to the lake without wetlands?
3. Look at the underside of the wetlands. What happened? What does this represent?
4. The models we are using are not perfect. What is wrong with our wetland models? How are they different from a wetland in the real world?
Part 3 – Toxic waste
1. The drink mix represented pesticides. What other real world toxic wastes could affect a watershed.
2. Where did the toxic waste go in your watershed?
3. What parts of the watershed were affected? What parts were not affected?
4. Describe any differences between the watershed with wetlands and the watershed without wetlands.
Comments (0)
THANK YOU — your feedback is very important to us! Give Feedback