Ballpark Figures: Quantitative Inquiries of Baseball and Beyond!

byKathryn Lee Kinsman

Objectives

Overview

I asked my professor if the math book I was using for research was "too old," implying that its contents might be inaccurate and obsolete. He emphatically replied, "Math is timeless!" Over the course of my seminar at Yale University with Professor Roger Howe, I realized the absolute truth in his statement. Math concepts survive over a long period of time only if they are widely applicable. Through my professor's lectures, I've learned that the use of estimation dates back to at least ancient attempts to measure land area and time. Ideas involving estimation have occupied many of the most famous mathematicians of all times. For instance, I learned that over two thousand years ago, Archimedes estimated pi as 223/71 Π 22/7, and in the seventeenth century, Newton developed a sophisticated method for approximating solutions to equations. Within the past hundred years the emergence of statistics has become an important discipline that studies populations through estimates. It was the latter fact that moved me to write a unit involving understanding estimation of large numbers. What besides math is timeless? Baseball! Napoleon Bonaparte once said, "The advancement and perfection of mathematics are intimately connected with the prosperity of the State." So too can be said with a great baseball team.

My unit will emphasize estimation by exploring relative order of magnitude and relative size as it relates to our decimal system. Too often students don't understand the difference between a thousand and a hundred thousand, or even a million and a billion. I want students to have a better understanding of the value of very large numbers! I will accomplish this by using baseball stadiums to investigate several quantitative aspects of this game. The first goal will be to investigate the economic impact, and perceived value on the part of the fans: attendance, concession sales, ticket prices, ballplayer salaries, and other related topics of student interest. (All issues students want to research for clarification should have a relevant purpose before they go looking for data.) Secondly, students will investigate physical characteristics of a baseball stadium: they will contrast distances of the outfield fences to home plate. All playing fields vary in size from one to the next, therefore, students can determine whether the standard for a home run is fairly constant. Distances will be compared with homeruns hit in various parks located around the world. A possible extension would be for students to determine the area of the playing field and compare it to the area of the stands for that stadium.

One reason I am using baseball as an analogy might be because my husband is a coach. Most importantly, baseball is an immensely popular sport where I live (North Carolina). And it is especially motivating to children. Many of my students (boys and girls) play on some sort of local little league team. According to the official web site of Little League Baseball, there are more than 2.3 million players in Little League Baseball, worldwide, as of 2007, including 400,000 girls registered in Girl's Softball 1. A final reason I chose baseball is because professional baseball teams are located in other developed countries of the world. Baseball's popularity has been spreading in recent decades, but it already had spread to a number of countries in the 1860s and 70s. The game is followed with fervent interest in Japan, Taiwan, South Korea, Mexico, Venezuela, Cuba, the Dominican Republic, other Caribbean countries, and elsewhere. The International Baseball Federation (IBAF) was founded in 1938 and now has 112 member countries; it has organized the Baseball World Cup since it's start. These facts will allow me to offer a further exploration into relative sizes by researching ballparks in these developed countries across the globe. Students will be able to apply their knowledge at the end of the unit by completing a web-based research project. Requirements for this project will be differentiated to meet all students' needs. They will research a country that has a professional baseball team. Students will collect the same quantitative baseball data as before, but this time it will be for their chosen country. In addition, the students will collect quantitative data such as total population, annual population growth, population density, land area, and any other related topics as they become of interest during research. This final formative assessment project is intended for students to discover that there could be a proportional relationship between population growth and its impact on the land and the environment. Its anticipated purpose is for them to consider what the environmental impact might be of an overcrowded town or city.

Why am I making the connection between baseball and different countries around the world? I teach at an International Baccalaureate school. At the elementary school level, basically this means that internationalism should be reflected in almost everything we teach. One ultimate goal of the IB program is for students to build the desire to take action after they complete research and interpret their findings. Upon completion of this entire unit, students will become more conscious of not only just how large big numbers are, but also how numbers affect our lifestyles and our environment. My hope is for my students to be reflective and responsible citizens. I want them to ascertain reasonable ways to reduce the human and environmental impacts they've discovered from their research.

Rationale

Approximately 35 people move to Charlotte every day. The district that I teach in, Charlotte-Mecklenburg Schools (CMS), grows by approximately 4,000 students per year! We are one of the largest school districts in the nation! My school is one of 173 in the CMS District that encompasses more than 133,000 students in grades K-12. They come from all different ethnic backgrounds, all different types of families, and are at all different levels of physical and academic ability. Nearly half of the students in the district qualify for free or reduced lunch, which is the federal standard for measuring poverty. We are home to students who are from 151 countries, and speak 120 different languages. According to my district's website, approximately 42% are African-American, 35% are Caucasian/White, 15% are Hispanic/Latino, 4% are Asian-American, and 4% are American Indian/Multiracial. These statistics only reflect the tip of the iceberg when it comes to diversity, as each of those groups contains many socioeconomic, cultural, ethnic, special-needs and religious subgroups 2.

I teach at Lansdowne Elementary School in Charlotte, North Carolina. At Lansdowne we follow the Primary years Program (PYP) of the International Baccalaureate Organization (IBO). It is a transdisciplinary program of international education that draws from research and best practice from a range of national systems designed to foster the development of the whole child (IBO 2008). Every single student in my school receives the benefits of this program. My classroom is quite diverse not only because of my student's demographics, but also because the PYP brings the whole world into my room! Simply put, Lansdowne Elementary is an archetype of CMS.

Still, it is hard to imagine the growing impact of such a large district on any of our local schools. To the outsider, we are diverse, we get new students every couple weeks, and we work hard to make our national and state goals. But it seems the only thing people really notice is the new set of trailers (mobile classrooms) outside the schools each year! They really don't understand that student numbers are getting so large and are constantly changing. District leaders have no choice but to try and reasonably estimate this growth. How can they estimate such large numbers? Why is estimation significant to CMS, or to anyone?

Estimation is one of the most important strategies we use to compute everyday math problems and considered to be a significant topic in school mathematics, as confirmed in various curriculum documents (NCTM, 2000). Yet, the textbook we use in my classroom seems to give it little attention. In conjunction with this situation, I also confess that, in my classroom much more attention is paid to computation than to estimation! In my state's curriculum, estimation is treated as more of a process than as content knowledge. It is neglected, poorly motivated, frequently limited to rounding, and is not integrated into any other curriculum topics. There are several reasons for placing a greater emphasis on this strategy in our classrooms. Barbara Reys (1992) suggested that "over 80% of all mathematical applications call for estimation, rather than exact computation," and Northcote and McIntosh (1999) found that adults' everyday mathematics consists mostly of mental computations; and many of these involve estimation. Just think, how many times have we asked ourselves questions like: Do I have enough gas in the car to get home? What time do I need to leave to get to the 7:00 staff meeting? How many carbohydrates are in that cafeteria burger and fries? Can we afford a vacation during spring break this year? How much coffee should I make for my dinner party?

Thinking about these types of questions, I've discovered just how extensively we, as adults, use estimation in daily life. So I feel the absolute need to establish an estimation mindset in my students. What I've realized is this, much like professional baseball, estimating too, requires mental computation and thinking - neither process can rely solely on rules or mechanical procedures. My hope and main objective for this unit is to develop my student's number sense so that they will come to view estimation as a distinct way of thinking, rather than as a collection of unconnected rules; as now, I feel it has been in my class for years - strike one! Estimation is such a broad topic, therefore, I want my 5 th grade students to grasp only specific, important ideas that I feel have been lost in my classroom. In this unit I will focus on the importance of place values, as they are the building blocks of our decimal system, relative order of magnitude, and finally relative size of quantities.

Undoubtedly, the increasing emphasis on estimation in the elementary classroom may also be due to the constant advancements in technology. Especially with the advent of calculators in the classroom, in my opinion it is essential for students to not only derive an answer, but also, to be able to judge the reasonableness of what is displayed on their screen. As mathematician and professor at Yale University, Roger Howe states, "One of the worst features of calculators is that they make us stupid by providing too many decimal places" (2008)! Estimation is an important sense-making strategy and one goal of this unit is to show students that the first, or leftmost, digit matters the most.

Isn't it distressing to see upper-elementary students solve problems such as $2.75 + $1.25 by using a calculator? Children are so preoccupied with obtaining the exact right answer it often compels them to perform unnecessary calculations; and ultimately, it prevents them from gaining the experience needed to devise an appropriate estimate in a given situation! Therefore, we need to stress that estimation is so often used in real life as an important consumer tool. It helps people make choices about the level of accuracy required to solve real-life mathematical problems. Should I estimate or use mental computation? Should I use a calculator or paper and pencil? Comparison-shopping involves a lot of estimating. We (teachers especially) want to determine the best price for our purchases. We value that perfect price so much that large consumer stores such as Best Buy© have branded their name as such! Consumers are best served if they know a variety of estimation strategies.

Why would 5 th graders, in particular, need to estimate rather than just round numbers? First, they may need to estimate because an exact answer is simply unobtainable and they have no other choice (Usiskin 1986). This is especially true on state tests. In real life and example would be when our grade level goes on field trips. The cafeteria manager must estimate the amount of food to prepare for the children when we return for our late lunch. It is impossible to serve exact portions of food therefore our cafeteria manager must estimate what might be needed. It is her only choice!

A second reason students need to estimate is because estimating increases the ease of understanding (Usiskin 1986), especially when it comes to larger numbers of the world that continuously change, like the world's population. For example, in an environmental debate over the number of trees needed annually for the production of pencils, using an approximation of four million pencils rather than, lets say, the (possible) exact figure 3,958,241 makes it easier for students to understand the argument and remember the statistical reasoning. This approximation is easier for children to grasp than the more precise actual figure. Estimates used to increase clarity are almost always calculated by rounding, which underscores an interesting irony in mathematics: clarity and precision are often in conflict with one another (Whitin & Wilde 1992).

And lastly, students need to know that estimates are just easier to use (Usiskin 1986)! Estimating for a purpose focuses on operating with numbers rather than merely understanding them. Establishing reasonable benchmarks will be one of the first tasks students will accomplish as they begin this unit. Tom Parker (1983; 1987) describes establishing estimation benchmarks as his "rules of thumb" or personal estimates. Some of his examples are; one acre will park a hundred cars; it takes about forty gallons of maple sap to make one gallon of maple syrup; a farmer needs 6 tons of hay per cow per year. Students can use these estimates to solve a problem or make a decision much more efficiently than say computing an exact answer and then trying to round that number.

Mathematical Objectives

Tommy Lasorda once said about Fernando Valenzuela, "All last year we tried to teach him English, and the only word he learned was million!" I'd argue that Valenzuela knew more than his coach thought! The first stage of estimation is developing the idea of relative place value and that the biggest decimal place value matters the most. Place values are the building blocks of our decimal system. So at the very beginning of the unit students will explore the relative orders of magnitude (sizes of individual place values) in the decimal system. I will begin by having the students set reasonable benchmarks for each order of magnitude from the thousandths place to the billions place in our decimal system. I set this range according to the North Carolina Standard Course of Study. (See no.1 in Appendix A)

Students will become good estimators when they have certain benchmarks or reference points upon which to base their estimates. For example, they should discover the orders of magnitudes of familiar things: the width of their hand is about 10 centimeters (much more than 1 centimeter, and much less than a meter); the tile on their classroom floor is a foot square, or (about) 30 centimeters wide; the height from the floor to the door handle is 1 meter; the front chalkboard is 10 meters long; and the back side of the building is 100 meters long: and so forth. Classroom and body benchmarks should be set based on powers of ten, it's just simpler! The metric system is based on powers of ten so it should be utilized as much as possible when establishing these ballpark estimates. Students will then estimate with much more reasonableness throughout the year because they have these concrete benchmarks to work with.

Once the students establish a set of reasonable benchmarks based on the powers of ten, they will further explore the decimal place value system. Students will also establish how many decimal places are in a number. According to Roger Howe, Often, we want to

do more than say whether one number is larger than another, we want to say how much larger it is, or that it is very much larger. We also want to say when two numbers are close to one another. Paying attention to place value components also makes these things easy to do. The main point here is that multiplying by 10 just increases order of magnitude by 1. This is true no matter what decimal place we are talking about. Thus, given any decimal place, the place just to the left represents numbers 10 times as large as the given place, and the place just to the right represents numbers only 1/10 the size of the given place. Two places to the left, you find numbers 100 times as large as where you are, and two places to the right, the numbers are only 1/100 of the place where you are. For facility with estimation, it is important that students understand not only the values of each place, but also these relative values of the places (2008).

Look at the expanded form of the base 10 number below and ask yourself, where is MOST of the number?

image 08.05.05.01

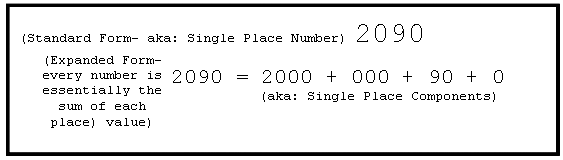
When we write in expanded form we do not need to write the 000 (hundreds) and the 0 (ones) place values. But, when writing a single place number, 2090, we need to write the zeros to understand the correct magnitude represented by each digit of that number. A basic fact is that order of magnitude sorts numbers according to size (Howe, 2008). Order of magnitude of a base ten number is defined as the order of magnitude of its largest (non-zero) place value component. So, 9,436 has order of magnitude 3, the same as its largest decimal component, 9000; and the 400 has order of magnitude 2, the 30 has order of magnitude 1, and the 6 has order of magnitude 0. The main point is that no two place value components have the same order of magnitude.

image 08.05.05.02

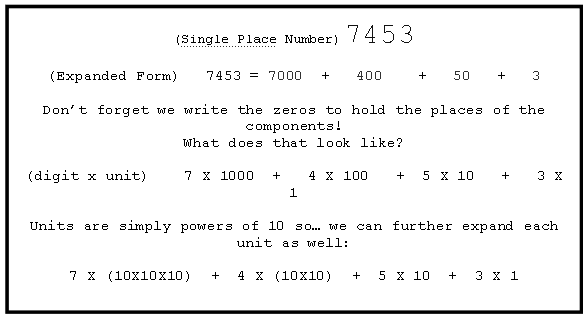
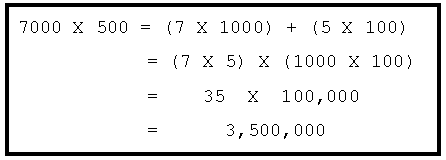
We call a digit times a power of ten a single place number, or a very round number. After dissecting (using the associative and commutative properties) single place numbers students will complete several calculations such as 7000 X 500.

image 08.05.05.03

Upon completion of the first stage of estimation, students should discover that, as noted in the quotation above, there is a fixed relationship between the places such that each decimal place to the left is ten times bigger and each place to the right is ten times smaller. Babe Ruth certainly understood this general idea when he said, "I'll promise to go easier on the drinkin' and get to bed earlier, but not for fifty thousand dollars, or two-hundred fifty thousand dollars will I give up women! They're too much fun."

The second stage of estimation is developing the importance of the leading digit, meaning the leftmost digit, or the digit of the leading (i.e., largest,) single place component! The decimal system is highly compatible with the ordering of the whole numbers, and makes it easy to compare numbers. For any number of any magnitude, the leading single place component tells you most (at least half) of the number. And each successive digit in a number is giving you a smaller and smaller "piece" of the number. Therefore, one can get a good idea of the value of a number just by its first digit!

I was a geologist before I became a teacher, and often the data I used for certain calculations included large measurements. For example, the height and length of mountain ranges and the radii of different planets were often used. Take the radius of the Earth. One can often find so-called "accurate" measurements such as 3,928 miles. How can one possibly measure the Earth's radius with all its mountain peaks, gorges and deep ocean crevasses to a fourth significant figure? It does not make sense. Therefore, we approximate it to 4,000 miles and can be defined to three significant figures. Roger Howe states that, "for many of our purposes, it suffices to know a number to one significant figure. For most purposes, two significant figures are enough and it's rare to know a real life number to more than three significant figures. All we need to know, or can expect to know, is an approximate value, and the largest decimal components supply this with great efficiency (2008)."

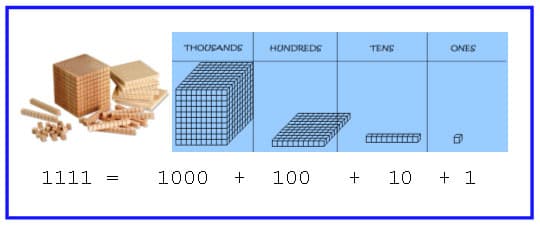
Students will duplicate this process by using hands-on manipulatives. Number cubes will help them visually dissect different single place numbers into their components and then further in to their expanded units. Again I will direct students to notice which place value holds MOST of the number. (See no.2 in Appendix A)

image 08.05.05.04

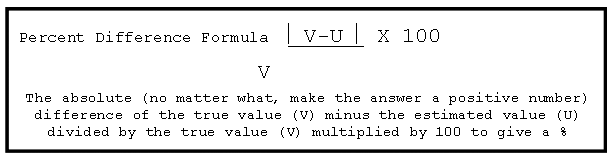
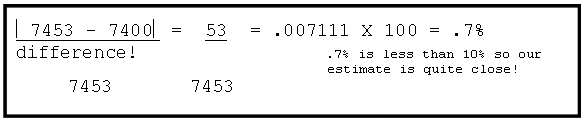
The crucial idea is that of emphasizing relative place value. As seen above, each successive single place component is giving you a smaller and smaller "piece" of the entire number! What about really large numbers like the population of the earth, which is constantly changing? One might ask if this same idea will still hold water. For larger numbers it is harder to estimate reasonably therefore, we must approximate. What is the difference between estimation and approximation you ask? We will say that estimation is getting within 10% error and approximation is anything better than 10%. For my purposes in 5 th grade, I will demonstrate the following percent difference formula for the whole class to help show the leading components of a single place number are the most important.

image 08.05.05.06

If possible, higher-level students can calculate the relative difference between a single place number and its minimum estimation:

image 08.05.05.07

The corresponding idea for approximation is relative error. Both relative and absolute error can be controlled in terms of decimal expansions. A key concept is significant digit. It is pointed out that relative accuracy of approximation improves rapidly with the number of significant digits. It is usually unreasonable to expect to know a "real-life" number (meaning the result of a measurement) to more than three or four significant digits, and often one must settle for, and can live with, much less. Failure to appreciate the limits of accuracy seems to be one of the most pervasive forms of innumeracy: it affects many people who are for the most part quite comfortable with numbers. Scientific notation, which focuses attention on the size of numbers and the accuracy to which they are known, is also discussed (Howe 2008).

Strategies

Like a great baseball team, estimation strategies are developed through careful instruction, discussion, and practice! So as the coach of my classroom, my new game plan is to make my 5 th grade students feel comfortable with estimation and mathematical thinking. For the best development of my team, the following three phases will be included in my plan of action: instruction, practice, and assessment. However, as a teacher in an IB elementary school, my additional task will be to develop international mindedness within the unit as well. My principal places students with me that will benefit from the strengths that I have to offer. Because I have a scientific background, my students are very often engaged in small-group, hands-on experiments and projects. They make predictions, test them, observe, then form and defend an educated opinion. I use a lot of visual representation such as children's books, photographs, posters, videos; computer software such as Microsoft PowerPoint©, SMART Technologies SMART Board© Notebook; and/or an overhead projector. Many of these resources will be used throughout this unit to help the students visually travel around the world. They will explore relationships of relative size as they think multiplicatively, complete research, share it, and compare their important findings regarding different countries around the world.

A basic conceptual development must be established so that later estimation exercises become simple. Students should understand the size of a number before operating with it. Therefore, body and classroom benchmarks will be set and displayed in the room (as a giant decimal place value chart) to be viewed and used throughout the unit. Estimation offers an alternative way of developing concepts related to numbers. A hanging illustration constantly emphasizes to students the importance of understanding the size of a number relative to another. This will become especially useful when investigating decimals later in the year. Students I've had in the past seem to be conditioned to think that "more digits means bigger" numbers when looking at a decimal fraction. Only after a carefully led discussion will students begin to understand that the number of digits contained in a decimal fraction has little to do with its size! (see figure below)

image 08.05.05.08

Students will explore single place numbers by expanding each of their single place components. They will see that each expanded component is a digit multiplied by a unit. For example: 7,986 = 7 X 1000 + 9 X 100 + 8 X 10 + 6 X 1. They will further expand each unit as a power of ten. So: 7 X (10 X 10 X 10) + 9 X (10 X 10) + 8 X 10 + 6 X 1. They will be able to see that each place is simply ten times larger than the one before it.

As they work collaboratively with place value charts and base ten blocks, students will also notice that the leading component gives them at least half the number! That is, the leading place value component is larger than all the rest of the components combined! By visually dissecting different single place numbers into their components students will be able to generate estimations with much more reasonableness. For example, they will be asked to dissect a number such as 7,986 using a place value chart with base ten blocks and the expansion method shown in the above paragraph. They will discover that each successive single place component gives them a smaller and smaller "piece" of the entire number. The smaller "pieces" of the number are insignificant, therefore not necessary to look for our estimating purposes in class. Students will be able to understand that 7,900 (or in this case, 8,000 would be even better) would be easier to use in a computation, and would give a satisfactory answer.

After an estimate has been made I will use the relative difference formula to prove to students that their estimate is reasonable. For example, for students who use 7900 as an estimate, I will take the absolute value of 7986 - 7900 and divide the answer by 7986. The answer (.0107) will be multiplied by 100% ≈ 1%. For students who used 8000 as an estimate I will take the absolute value of 7986 - 8000 and divide the answer by 7986. The answer (.0018) will be multiplied by 100% ≈ .18%. An answer less than 10% indicates that a reasonable estimate was made. It is possible for higher-level students to compute relative differences as long as the formula is provided and explained to them.

Students will further use this knowledge to calculate real-life estimation situations. They will compare teacher salaries with professional baseball player salaries. Students will use the Internet to find a relatively accurate amount of how much a first year major league professional ballplayer makes compared to an experienced, top-salaried player makes. They will then use the Internet to determine (with relative accuracy) how much a first year teacher in their district makes compared to an experienced, top-salaried teacher makes. They will make reasonable estimates of these numbers. Students will also determine the amount of time a ballplayer must contribute in order to earn that salary (by using the internet) and compare it with the amount of time the teacher contributes to earn their salary. For example, last year I made approximately $35,000 in ten months. I worked roughly 10 hours a day, multiplied by 5 days a week = 50 hours a week. I worked 33 weeks, so 50 hours X 33 weeks = 1650 hours throughout the school year. A good approximation would be 1700 hours because I also often take work home during the week, on weekends, and days off. If I divide the number of hours I work by my salary, I get paid $20.59 an hour, which I would estimate to $21.00 an hour. The average major league ballplayer salary is $2,476,589 ≈ $2,500,000 for 8 months of work. Lets say they work 9 hours a day, multiplied by 5 days a week = 45 hours a week. They work roughly 32 weeks, so 45 hours X 32 weeks = 1440 hours throughout the season. A good approximation might be 1500 hours because they often workout during their time off. If I divide the number of hours they work by their salary, an average ballplayer gets paid $1666 an hour, which I would estimate to $1700 an hour! Students can see the large difference in salary and should formulate their own opinion about the time spent working for a certain salary. They should think about: how much effort does this ballplayer spend making that money? How much effort does the teacher spend earning his/her money? Discussions will take place regarding the relative size of their findings for the ballplayer vs. the teacher.

Students will then explore relative sizes related to attending a typical professional baseball game. The well-known baseball stadium in Charlotte, North Carolina, Knights Castle, will be used for this first problem. Students will use the Internet to find (and then reasonably estimate) the following: attendance per game and per year; the area of the playing field and the area of the stands; concession sales per game and per year; cost of tickets (general seating, vs. regular vs. box vs. season) per game and per year; the amount of time spent watching a live ballgame per game and per year compared with the amount of time spent watching a ballgame on TV (as this is certainly one reason that baseball players are able to earn large salaries!); the amount of driving needed to attend one game and all home games; the difference between the ballplayers salaries; and any other items of student interest. For example: $3586 in hotdog sales for one game ≈ $3600 possible estimate. There are 162 ballgames per season ≈ 160 possible estimate. So, $3600 X 160 games = ($36 X 16) X (10 X 10 X 10) = $576,000 ≈ $580,000 in hotdog sales per season. Students will discover easier estimations to use in their computations as they work collaboratively with classmates. For example, instead of using $3600 X 160, they might use numbers that are considered very round numbers such as $4000 X 200. Students will discover the more very round numbers they use in their computations, the easier it is to find an answer.

As an extra credit assignment or classroom extension activity, students can use the Internet to determine the distance of the outfield fences (left field, center field, right field) to the home plate (for a professional baseball field of their choice located anywhere in the world). They will determine an estimate of how man home-run hits were made over the fences. Their data will be combined with their classmates' data to determine if the distances are fairly constant or quite different. If they are fairly constant, we could say that the standard for a home run was fairly constant! If the distances from the fences to home plate varied a lot, then the distances can be compared with home runs hit in the various global parks.

The basic idea of population density will also be introduced. Students will use Knights Castle to compare the area of the playing field and the number of ballplayers on it with the area of the stands and the number of fans in it. Students will generate illustrations such as the one below using information collected from the Internet.

image 08.05.05.09

Knights Castle holds 10,002 fans in the stands. There are ten players (including the batter and fielders) on the playing field. Students will estimate these figures based on photographs and Internet information. (The books, Betcha! by Stuart J. Murphy, Great Estimations and Greater Estimations by Burce Goldstone show examples on how to estimate large, unknown quantities.) They will also determine the area of the stands based on Internet information. Students will use their previously drawn illustration to determine the area of the playing field. They should conclude that the estimated areas are relatively the same size therefore, the population density of the stands is much greater than it is on the field. A question will be posed at this juncture; what impact do the fans have in the stands versus the impact the players have on the field in terms of waste? Students discuss ideas of the relative impact of fans (examples- lots of garbage left in the stands so it looks dirty, more people might mean more broken items-like the plastic seats- because they are used more, everything else is concrete which can't be worn out easily, etc) versus players (examples- no garbage on the field only in dugout areas, spit from tobacco is the only thing on the ground, certain outfield areas are more worn out because of players using the same spots over and over, etc). They then discuss any opinions they may have formed throughout their discussion with their classmates.

Here is a more complex example of a real-life problem that students will interview their parents/guardians for. They will collect the estimations (answering in very round numbers) to several questions (see no.3 in Appendix A). Once information is collected and returned to school, students will be placed in cooperative groups of 3-4 students to collaboratively answer the following questions: How may miles do all Americans drive in a year? (Students will have to know how many miles per day, how many cars there are; teacher will supply estimate for number of Americans that drive ≈150,000,000). Each student will use their own data to calculate their own answers, but they will work together to solve the problem. Students will then collaborate to answer the following questions: How much gas does all Americans use? How much does it cost? How long do your parents have to work to pay for their driving? How much time do we spend driving? Students will compare the answers to the last to numbers. They will discuss and form their own opinion regarding whether it is worth their parents time to have a car! (In my family we estimated that I work 1 hour to drive 1 hour!)

The unit will culminate with an Internet research-based project. From a list, they will choose a country that has a professional baseball team and one other country that does not. Students will prepare a data table with reasonable estimates of the following items: What is the attendance of a typical baseball game? What is the attendance per year? What are ticket prices per game and per year? What is the total concession sales per game and per year? What is a typical baseball player salary? What is the area of the playing field? What is the area of the stands? What is the total population of each country? What is the land area of each country? What is the number of people infected with HIV/AIDS in each country? What is the total energy use per year in each country? What is the total CO 2 emission per year in each country? As students research, they may include any information they've found to be interesting. Numbers will be properly estimated to the most reasonable decimal place.

Why the shift beyond professional baseball to studies of relative size in countries? Baseball was the motivational tool to get students interested in learning the important stages of estimation. Throughout the unit, students received enough knowledge about relative size, countries around the world, and how to formulate opinions based on data. They will take this knowledge and apply it in their individual formative assessment. After the required estimations have been collected, organized, and reviewed, students will formulate an opinion based on their data. They will compare and contrast the data on the two different countries on a well-organized chart. Students will decipher whether there is a greater human impact on the environment in one country versus the other and why. They will write a proposal as to how the country could conserve their environment rather than continue to damage it.

Classroom Activities

Overview

How will I develop sound estimating strategies in my classroom? I will use a variety of situations and real-life problem-solving experiences. According to Whitin and Wilde, my students will then become flexible thinkers (1992). In this unit, I will also use children's literature and Discovery Education videos to demonstrate why people use estimation in the first place. Students will learn the sizes of individual place values in the decimal system from the thousandths place up to the billions place. They will discover that each place is ten times bigger as they move to the left and ten times smaller as they move to the right. The notational system hides this fact so it is hard to realize how big a number can actually get (Howe 2008). Students will discover the importance of the leading digit in a given number and the increasing irrelevance of subsequent digits when dealing with extremely large numbers that often change; populations of countries or square surface area of an ocean. Each day, estimation problems taught in class will be based on quantitative inquiries related to the game of baseball; attendance, concession sales, ticket prices, area of the playing field, area of the stands, ballplayer salaries, and other related topics of student interest. We will take these original findings and then compare and contrast them with baseball stadiums located in other developed countries around the world. Students will discuss the class findings and defend any opinions they will have formed based on the results. For homework they will complete real-life estimation problems relevant to their own lives or the lives of their parents/guardians. Students will be able to apply their knowledge at the end of the unit by completing a web-based research project. It will be differentiated in its requirements however all students will have the same goal. They will research a country that has a professional baseball team. Students will collect the same quantitative baseball data as before, but this time it will be for their chosen country. In addition, the students will collect quantitative data such as total population, annual population growth, population density, land area, and any other related topics of their interest. This final formative assessment project is intended for to students discover that some countries are densely populated and therefore have much larger impacts on the land and the environment. They will again defend an opinion that will form based on the outcome of their research. For example, India is much more densely populated than most countries - approximately 10 times the density of the United States! It has a reputation of being overcrowded, dirty, and having poor environmental statistics. On the other hand, Canada has less than 1/10 th the density of the United States. It has a reputation of being a very clean, beautiful, and environmentally conscious country. They take pride in their high standards for air and water quality. Are these accusations due to the human impact based on their populations? Many opinions can be debated.

Day 1-2

Joe Torre has a lot in common with me in that we both have high expectations of our players. In baseball, because of experience, a hitter can reasonably predict what throw the pitcher will be throwing. In the classroom, because of experience, a teacher can reasonably predict which students will understand the lesson and which will need extra help. However, none of us are mind-readers so occasionally we strike out! Therefore, we need to set some benchmarks that our players can strive for. The word "about" is such a sophisticated idea and should not be used as sparsely as it is. If Joe Torre asked Chan-Ho Park "about how many strikeouts do you throw in a year? He most likely will get a plethora of answers depending on when he asked. However, if Joe Torre narrowed his field of choices by asking, "Would you say you throw between 100 and 200 strikeouts a year?" he would get a more accurate estimate. In my classroom, figuring out the order of magnitude of a quantity by comparing it with powers of ten will allow us to set initial ballparks for students to estimate between.

A good introductory book to read to the class is called Math Curse by Jon Scieszka and Lane Smith. There are also two short videos available on the Internet that could be shown before the unit begins 3. A large decimal place value chart will be constructed by students and hung from the ceiling in front of the room. Each place will be labeled with a single place component in standard and word form. Students will also bring in photos or examples of objects that visually display relatively the same size. For example, with regards to the hundred's place, students can paste 100 pennies on the chart paper, along with a photo of a building that is 100 stories tall, a copy of a $100 bill, and anything else the students can find. For fifth grade, the chart will encompass places from the thousandths up to the billions. The entire place value chart will be displayed throughout the unit so students can add to it as they become more knowledgeable about each place's size. There are many books available to help students visualize the relative size of some place values 4. There are also two Internet sites that offer interesting visuals for the larger place values 5.

Day 3-4

After benchmarks are set and easily accessible in the classroom, students will further explore the size of numbers by expanding each single place component to its digit and base ten unit. There is an Abbott and Costello video that is available on the Internet that would be a fun place to start off this lesson 6. The book, The Best of Times by Grag Tang is another tool you can use to get students motivated before they work collaboratively. With a partner students will break apart several single place numbers and simple multiplication problems to discover the value of each single place component. For example: 7,986 = 7 X 1000 + 9 X 100 + 8 X 10 + 6 X 1. They will further expand each unit as a power of ten. So: 7 X (10 X 10 X 10) + 9 X (10 X 10) + 8 X 10 + 6 X 1. They will be able to see that each place is simply ten times larger than the one before it.

Day 5-6

After a good week or so, students can begin to apply their place value knowledge with real-life baseball estimations. There is a short movie clip on the Internet from the movie Little Big League that will surely catch students' attention 7. The books, Betcha! by Stuart J. Murphy, Great Estimations and Greater Estimations by Bruce Goldsone can also be used to introduce easy estimating strategies. They will collect information off the Internet regarding several quantitative aspects of a single baseball game. Students will then have to determine this information for the entire season. For example: $3586 in hotdog sales for one game = $3600 possible estimate. 162 ballgames per season = 160 possible estimate. So, $3600 X 160 games = ($36 X 16) X (10 X 10 X 10) = $576,000 = $580,000 in hotdog sales per season.

Once students are comfortable with relative place value, they can explore much larger numbers. There is a short movie clip from Back to the Future Part III available on the Internet to use at the beginning of this lesson 8. The book, On Beyond A Million by David M. Schwartz can also be used. In the classroom, will collect the world's current population from as many sources as possible. The teacher should compute the relative difference between the maximum number found and the minimum number found. He/she will determine if these reported numbers are reasonable estimates or simply approximations. Remember if the percent difference is less than 10%, it is a reasonable estimate.

Possible Extension Activity: With a partner, students will then apply this new knowledge and compare values of data they have already collected from their baseball inquiries. They will find the percent difference for each inquiry. They will take turns with whose data will be the important value (V) and whose will be the estimated value (U). Students will be able to determine if their answers were reasonably close to other data in their small groups. Next, students will compare Charlotte's Knights Castle data to a professional baseball stadium in another country. They will use the internet to find the same inquiries as before. Students will conclude with the idea that only the first 2-3 digits really matter in large inexact global numbers. They will discuss their findings and formulate an opinion debating whether extremely large numbers of measurement are accurate or not.

Day 7-10

Students will begin working on their research project. A rubric with requirements and grading expectations will be handed out the first day. (See no.4 in Appendix A) They will choose 2 countries, one from a provided list, and one using a world atlas-to find one not found on the list. (See no.5 in Appendix A) They will collect the required data and create a chart to show all findings. Students will compare and contrast the two countries figures and reflect on whether there is a greater human impact on the environment in one country versus the other and why. They will think responsibly and write a proposal as to how the country could conserve their environment rather than continue to damage it. Several Internet sites can be used to help students find their information, especially www.wikipedia.org and www.answers.com. (Excellent literacy supplements can also be found at the same websites!)

Resources

Teacher Resosurces

Howe, Roger. "Taking Place Value Seriously: Arithmetic, Estimation and Algebra." January 2008, http://www.maa.org/pmet/resources/PlaceValue_RV1.pdf.

This paper is extremely informational as it discusses central themes of school mathematics. It attempts to point out ways to make the study of arithmetic more unified and more conceptual through systematic emphasis of place value structure in the decimal number system. The essay is divided into six sections, with sections one, two, and three being the most informative for this unit. Section one reviews the basic principles of decimal (base ten place value) notation. Section two is in four parts, which discuss how decimal notation permits efficient algorithms for the four basic operations (I focused on multiplication). And section three discusses ordering, estimation and approximation of numbers.

National Council of Teachers of Mathematics (NCTM). Estimation and Mental Computation. Reston, Virginia: National Council of Teachers of Mathematics, 1986.

This book was extremely useful to my research for this unit. It recognizes the importance of teaching and learning estimation. It is divided into five sections. The first five articles provide the framework. It emphasizes the usefulness of estimation, necessary thinking strategies and mind-set, the need for mental computation as a corequisite for computational estimation, and the artithemetic of approximate numbers. Articles 6-14 present specific instructional activities, providing suggestions for teaching mental computation and different types of estimation in the primary grades. Be weary of the effectiveness of some of the lessons, not all are worthy of your time! Articles 15-21 stress the variety of types and uses for estimation. Articles 22-25 focus on estimation in measurement, including teaching activities and mathematical topics for grades K-12. The last couple articles of the book comprises a review of research on teaching and learning estimation and a discussion of some difficulties and recent progress in attempts to test students' ability to estimate.

Northcote, M., and A.J. McIntosh. "What Mathematics Do Adults Really Do In Everyday Life?" Australian Primary Mathematics Classroom 4, no.1, (1999): 19-21.

This journal article describes the recent SAUCER Project at Edith Cowan University which was designed to answer questions such as what mathematics should really be taught, and what mathematics adults actually do in everyday life. The study involved stresses the close link between estimation and number sense.

Parker, Tom. Rules of Thumb. Boston: Houghton Mifflin, 1983.

Parker, Tom. Rules of Thumb #2. Boston: Houghton Mifflin, 1987.

Both these books include tons of trivia ranging from useful to obscure. I thumbed through them simply for real-life examples of mathematical benchmarks. These books would be interesting and fun to read if you are the kind of person who can't commit to reading straight through a book. It is definitely not intended for research purposes.

Reys, Robert E., and Barbara J. Reys. Guide to Using Estimation Skills and Strategies. Palo Alto, California: Dale Seymour Publications, 1983.

This guide discusses the implementation of teaching estimation as portrayed in the NCTM Standards. It gives a rationale, strategies and teaching suggestions. Estimation is defined in two categories, perceptual and computational. Using perceptual anchors and mental computation is described. Activities are given for teachers to use in helping students develop estimation strategies in the classroom.

Reys, Barbara J. "Estimation." In Teaching Mathematics in Grades K-8: Research-based Methods, edited by Thomas Post, 279-301. Boston: Allyn & Bacon, 1992.

Chapter 8, Estimation, of Post's book includes many of the major research findings in mathematics education regarding estimation. It includes a variety of ideas and activities for the elementary and junior high school mathematics teacher. It is a practical guide for integrating estimation into your classroom.

Usiskin, Zalman. "Reasons for Estimating." In Estimation and Mental Calculation 1986 Yearbook), edited by Harold Schoen. Reston, Virginia: National Council of Teachers of Mathematics, 1986.

This article begins with an examination of the reasons why estimation is viewed as foreign. Then, after some discussion of ideas relating to estimates, four major reasons for doing estimating are described and exemplified. Finally, reasons for teaching estimation are offered.

Whitin, David J., and Sandra Wilde. Read Any Good Math Lately? Children's Books for Mathematical Learning, K-6. New Hampshire: Heinemann Publications, 1992.

This book acquaints you with some of the best children's literature containing a mathematical subtext, including fiction nonfiction, poetry, books of games and puzzles, and books that reflect different cultures. The titles are diverse, but they all address a range of mathematical topics: place value, estimation, large numbers, geometry, measurement, fractions, classification, addition, subtraction, multiplication, and division.

Internet Resources

Answers.com. "Amateur and International Baseball." http://www.answers.com/topic/baseball?cat=technology (accessed July 12, 2008)

Answers.com. "Baseball: Background." http://www.answers.com/topic/baseball?cat=technology (accessed July 12, 2008)

Answers.com. "Little League Baseaball."

http://www.answers.com/topic/little-league-baseball (accessed July 12, 2008)

"Base Ten Blocks Photograph"

http://www.thedowsschoolroom.com/basetenblocks.jpg (accessed July 13, 2008)

Base Ten Blocks Used for Example on Place Value Chart.

http://www.picciotto.org/math-ed/early-math/graphics/fig-4.GIF (accessed July 13, 2008)

Britannica Concise Encycopedia. "Baseball Field Diagram." http://content.answers.com/main/content/img/BritannicaConcise/images/72121.gif

(accessed July 12, 2008)

Charlotte Knights Homepage. "Knights Stadium."

http://www.charlotteknights.com/ (accessed July 25, 2008)

Charlotte Mecklenburg Schools. "Diverse Student Body 2007-2008." http://www.cms.k12.nc.us/discover/pdf/08-09/Diversity08.pdf (accessed July 11, 2008)

Department of Public Instruction. "EOG Grade 5 Math Sample Items Goal 1 & 2." http://www.ncpublicschools.org/docs/accountability/testing/eog/math/20080428gr5goal1.pdf (accessed July 12, 2008)

Google Images. "Knights Castle Diagram."

http://www.baseballpilgrimages.com/AAA/charlotte2.jpg (accessed July 25, 2008)

International Baccalaureate Organization. "Primary Years Programme." http://www.ibo.org/pyp/ (accessed July 11, 2008)

Place Value Chart and Cut-Out Base Ten Blocks.

http://images.google.com/imgres?imgurl=http://olc.spsd.sk.ca/de/math1-3/imagebank/placevaluechart.gif&imgrefurl=http://olc.spsd.sk.ca/de/math1-3/baseten-1.html&h=361&w=672&sz=5&hl=en&start=11&tbnid=eo9-clHLZv0yyM:&tbnh=74&tbnw=138&prev=/images%3Fq%3Dbase%2Bten%2Bblocks%26gbv%3D2%26hl%3Den%26sa%3DG (accessed July 13, 2008)

Wikipedia.org. "Average Salary of a Professional Baseball Player."

http://wiki.answers.com/Q/What_is_the_average_salary_of_a_professional_baseball_player (accessed August 9, 2008)

Wikipedia.org. "History of Baseball Outside the United States." http://en.wikipedia.org/wiki/History_of_baseball_outside_the_United_States

(accessed July 22, 2008)

Wikipedia.org. "Baseball."

http://en.wikipedia.org/wiki/Baseball (accessed July 22, 2008)

Appendix A

1) Descriptive Information for the North Carolina End-of-Grade Test—Grade 5 Mathematics

Goal Description of Goal Percentage of Questions on Test

  1. Number and Operations. The learner will understand and compute with non-negative rational numbers. 20-25%
  2. Measurement. The learner will recognize and use standard units of metric and customary measurement. 10-15%
  3. Geometry. The learner will understand and use properties and relationships of plane figures. 25-30%
  4. Data Analysis and Probability. The learner will understand and use graphs and data analysis. 10-15%
  5. Algebra. The learner will demonstrate an understanding of patterns, relationships, and elementary algebraic representation. 20-25%

2) Chart for use with Base Ten Blocks

Thousands Hundreds Tens Ones
       

3) List of Questions for Parent/Guardian Interview Assignment

How many miles do you drive per day? How many cars do you have per household? How many gallons of gas will fill your car(s)? How much does gas cost per gallon? What is the total operating cost of your car(s); insurance, inspection, oil changes, property tax, basic maintenance (may include-washing, new tires, mufflers, windshield fluid, windshield wipers) monthly payment, down payment? How much time do you spend driving per day? How many hours per day do you work (based on 5 day work week)?

4) Formative Assessment Project Rubric

Student Name:

CATEGORY 4 3 2 1
Internet Use Successfully uses suggested internet links to find information and navigates within these sites easily without assistance. Usually able to use suggested internet links to find information and navigates within these sites easily without assistance. Occasionally able to use suggested internet links to find information and navigates within these sites easily without assistance. Needs assistance or supervision to use suggested internet links and/or to navigate within these sites.
Amount of Information All topics are addressed and all questions answered with at least 2 sentences about each. All topics are addressed and most questions answered with at least 2 sentences about each. All topics are addressed, and most questions answered with 1 sentence about each. One or more topics were not addressed.
Graphic Organizer Graphic organizer has been neatly completed and shows clear, logical relationships between all topics and subtopics. Graphic organizer has been completed and shows clear, logical relationships between most topics and subtopics. Graphic organizer has been started and includes some topics and subtopics. Somewhat neat. Graphic organizer has not been attempted or is incomplete. Needs much effort and neatness.
Proposal Information Information clearly relates to the main topic. It includes several supporting details and/or examples. Information clearly relates to the main topic. It provides 1-2 supporting details and/or examples. Information clearly relates to the main topic. No details and/or examples are given. Information has little or nothing to do with the main topic.
IB Attitudes Student always displayed self- management skills, was creative, neat, and reflective in their research. Student mostly displayed self-management skills and creativity. Mostly neat and mostly reflective in their research. At times, student displayed self-management skills but needed verbal reminders to stay on task. They were somewhat reflective in their research. Project somewhat neat. Student lacked self-management skills and needed several reminders to stay on task. They lacked neatness and reflectivity.

5) List of Countries for Project

Countries With Professional Baseball: Italy, Korea, Japan, United Kingdom, Australia, New Zealand, Cuba, Dominican Republic, Netherlands, Canada, South Africa, Mexico, Venezuela, Colombia, Puerto Rico, United States, China, Taiwan

Notes

1. Little League ballplayers' statistics generated from www.Littleleage.org accessed July 12, 2008.

2. Charlotte Mecklenburg student demographics generated from www.cms.k12.nc.us accessed July 12, 2008.

3. The Simpsons videos can be accessed at http://www.math.harvard.edu/~knill/mathmovies/

4. Children's books that can be used throughout the unit lessons:

Clement, Rod. Counting on Frank. Wisconsin: Gareth Stevens Publishing, 1991.

Clements, Andrew. A Million Dots. New York: Simon & Schuster Children's Publishing, 2006.

Goldstone, Bruce. Great Estimations. New York: Scholastic Press, 2006.

Goldstone, Bruce. Greater Estimations. New York: Scholastic Press, 2008.

Murphy, Stuart J. Betcha! New York: Harper Collins Publishers, 1997.

Schwartz, David M. How Much is a Million. New York: Lothrop Lee & Shepard Books, 1985.

Schwartz, David M. Millions to Measure. New York: Harper Collins Publishers, 2003.

Schwartz, David M. On Beyond a Million: An Amazing Math Journey. New York: Dragon Fly Books, 1999.

Scieszka, John and Lane Smith. Math Curse. New York: Penguin Books, 1995.

Tang, Greg. The Best of Times. New York: Scholastic Press, 2002.

Tang, Greg. The Grapes of Math. New York: Scholastic Press, 2001.

5. Internet Sites With Activities:

Lots of Dots activity can be accessed at http://www.vendian.org/envelope/dir2/lots_of_dots/

The Million $ Mission can be accessed at http://math.rice.edu/~lanius/pro/rich.html

6. Abbott & Costello video can be accessed at http://www.math.harvard.edu/~knill/mathmovies/

7. Little Big League video can be accessed at http://www.math.harvard.edu/~knill/mathmovies/

8. Back to the Future Part III video can be accessed at http://www.math.harvard.edu/~knill/mathmovies/


Comments (0)

Be the first person to comment

When you are finished viewing curriculum units on this Web site, please take a few minutes to provide feedback and help us understand how these units, which were created by public school teachers, are useful to others.
THANK YOU — your feedback is very important to us! Give Feedback