Lesson Plans and Activities
There is a fine line between certain topics taught in Algebra-1 and Algebra-2, which is the reason I will create lesson plans for both. The introductory part of the curriculum unit can be easily directed to the population of students in Algebra-1, due to the calculations, formulas and transformations to be applied. Also, given the analysis of area within the consumption and the efficiency contexts, the lessons can be applied as well to geometry.
The use of trigonometric functions and the angles of inclination for the panels in the installation process are very important. Skew angles, angles of inclination and other similar concepts will be defined and taught prior to the curriculum unit development. These numbers will vary depending on the zip code of the city, meaning that the sun directs its rays in different angles, depending on the location of the city and on the position of the solar panels. The calculations coming out of these data are directly related to the efficiency of the solar panels and are relevant to Algebra-1, Algebra-2 and Trigonometry.
Graphing equations based on the analysis of given information are very useful not only in math, but as well in science and other subjects; therefore, lessons on graphing equations with data obtained from our calculations from this curriculum unit are included too.
Lesson Plan-1: Solar Panels and Analysis of the Areas
Objectives: The objective of this hands-on lesson is to compare the influence of the changing areas of the solar panels in the calculation of power output and efficiency.
Materials: Solar panels of different sizes, multi meter /voltmeter, metal hanger or items to maintain the panels steady, table-chart to record measurements, graph paper, pen and pencil.
Procedure: Students calculate the area of each solar panel and record these data in their chart. There are 4 different panels in each group; therefore, each student in a group should have recorded 4 different results, one per each panel.
Students place their solar panels in a position facing the sun or another source of light. The angles of inclination of all the panels should be the same without any change. This demonstration is done maintaining the angle of inclination constant.
One at a time, the multi-meter is connected to the terminals of the solar panel to measure the voltage. The current as well needs to be measured, changing the units of reading in the multi-meter.
Students analyze their data and predict a relationship between area and current measured. The voltage may not show a significant change, with the tendency to stay constant but the amperes will show a change as a function of the area.
After writing their conclusions, students will move their solar panels to different points, distant from their original location and away from the light. Once again, the data observed need to be recorded in the chart. This information will serve students to analyze if the amperage varies with the distance from the source of light.
Students will come up with an empirical formula that relates the amperage with the area of the panel and with the distance from the source of energy. The outcome should show an inverse squared distance dependence. As an additional outcome, an empirical formula for efficiency as a function of the area of the panel and the distance from the source of light can be included. Finally, students will be directed to compare if there is a co-relation between the amperage and the efficiency.
There is time for a discussion about the data found and the empirical formulas. This is the first of two lessons about solar panels.
Lesson Plan-2: Solar Panels and Analysis of the Angle Tilted
Objective: Analysis of efficiency as a function of the angle of inclination of the panel.
Objectives: The objective of this hands-on lesson is to compare the influence of the tilted angle changes of the solar panels in the calculation of power output and efficiency.
Materials: Solar panels of different sizes, multi meter /voltmeter, metal hanger or items to maintain the panels steady, table-chart to record measurements, graph paper, protractor, pen and pencil.
Procedure: From the previous lesson, students will continue recording the information.
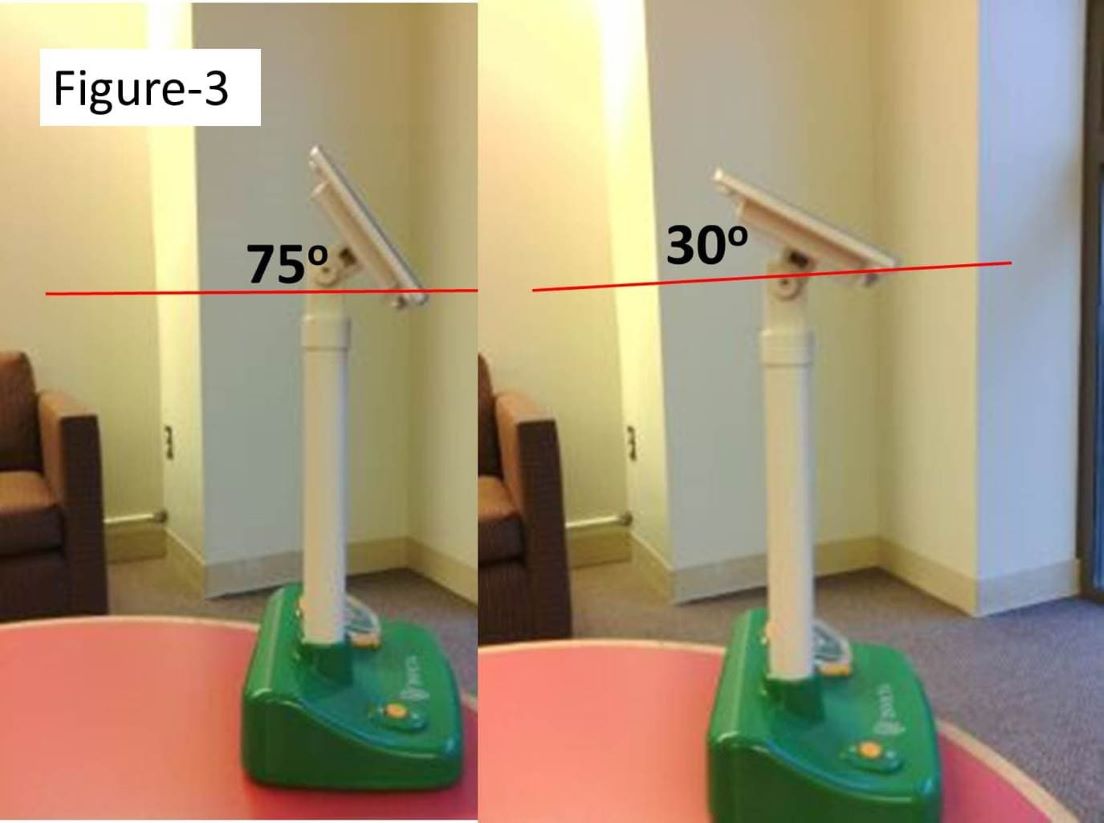
Students will keep the solar panel in a steady position without changing its location. The only change will be the angle of inclination. With a protractor, students will measure several angles between the panel and the horizon. The horizon is defined as a horizontal line coinciding with the bottom portion of the panel as it is shown in red color in figure-3.
Students will record in their data sheet the angle of inclination and the corresponding voltage measured with the voltmeter. In addition, the current, measured in amperes will be measured. The areas of their solar panels were already recorded the day before.
After 5 different inclinations, students will switch panels and record their results, using the same angles, but this time, the area of the panel will be different. The switch of the panels should end when every student has received the all different panels in their groups.
The final conclusion for the two days for each group should involve an analysis and discussion on:
What happens when the area increases?
What happens when the angle of inclination increases?
What happens when the distance from the source of energy varies?
Lesson Plan-3: Solar Energy at Jefferson High School
Objective: To determine the amount of energy wasted when lights in the empty lower gym are on.
Materials: Paper, PG&E invoice, calculator, pen or pencil.
Procedure: Letters to the administration and to the superintendent will be sent requesting permission to analyze an invoice for the month of May, 2013. The data obtained from the invoice will be our "control." In addition, a letter to PG&E will be sent, to enter in their educational project. PG&E provides training for teachers through workshops and webinars. A technician is sent to the class to help students to understand the facts of solar energy and how the solar panels work. If a technician is not available, I will provide the information.
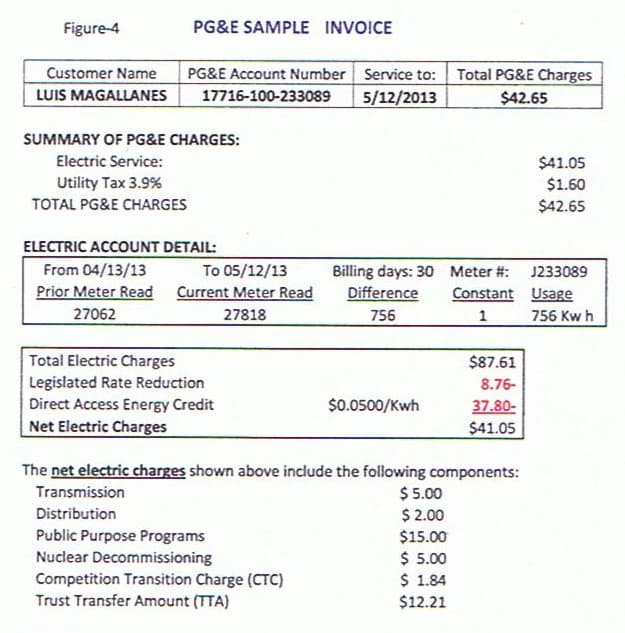
The most important part in this lesson is to obtain the data from the PG&E invoice. With these data, the cost of the energy used can be calculated. The information needed is the amount of energy used in a period of time. In figure-4, an invoice similar to the one provided by PG&E is shown. The amount of energy used from April 13 to May 12 was 756 Kwh. In this invoice, the real cost of the energy used in a period of time of 30 days was $87.61. However, some local governments provide incentives for reducing the energy used in comparison with the previous year. For the purpose of our calculations, we will use 756 Kwh and $87.61 to find the cost of 1 Kwh by simple division. The answer in this case is 11.58 cents per 1 Kwh. This is just an example, but it is very close to the 2011 average price 6 in US, of 1 Kwh at 10.75 cents.
Working in groups, students will count the number and wattage of incandescent bulbs and/or fluorescent bulbs per classroom, offices, gym and any other part lighted in the school. Students will also survey the classrooms to see the amount of electronic devices such as computers, monitors, microwaves, coffee-makers, water heaters, photocopy machines, telephones and loud speaker system. Students will create a list of household appliances with their respective energy usage. The goal with the above count is to isolate the amount of energy used in lighting up the entire school in a month. Then, dividing this amount by the number of bulbs, we can obtain the energy used per bulb per month. It is important to understand that we will find different types of bulbs, which it has to be accounted for accuracy. This last number obtained is very important to show how much energy is used in the gym that I am referring in the objective of this lesson.
Be the first to comment on this unit!
Comments: