Tape Model
Another way of visually reasoning with ratios and proportions is by means of a tape model. Consider the following example:
In the school cafeteria, 3 apples are eaten for every 7 oranges eaten. If 80 pieces of fruit have been eaten, how many of each fruit can we predict have been eaten?
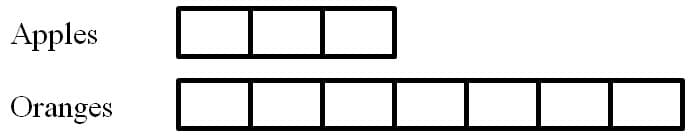
In the tape model, 3 boxes represent 3 apples and 7 boxes represent 7 oranges. The given ratio is clearly seen with a total of 10 boxes for the 10 pieces of fruit. Because the ratio will not change in a proportional relationship we can ask ourselves: What does each box represent if there are 80 pieces of fruit? Because there are 10 boxes of equal value, it is apparent that each box represents 8 pieces of fruit. So we can predict that there would have been 24 apples and 56 oranges eaten. The visual nature and focus on the constant rate of proportion makes this model a valuable tool in this unit. However the order of introducing this model must be considered. This strategy will be introduced after the previous strategies and when students have a sufficient understanding of the multiplicative relationship of ratios in a proportional relationship. They are excellent models to represent and solve missing value problems but have the potential to be used by students without a conceptual understanding. If this is the case, students tend to use this strategy as an algorithm without understanding the reasoning behind the model.
Comments: