Classroom Activities
Close Reading and Annotating Text
Students engage in a close reading of text excerpts on the EPA website for each of the following topics: stormwater runoff,57 gray infrastructure,58 environmental impacts of stormwater runoff, green infrastructure basics59 and examples.60 As they close read, students will annotate the text with a specific focus each time. Students annotate by hand or by using a software program or browser extension such as Kami. In the first read, students focus on the “what” of the content and identify key vocabulary for each topic. In their second read, students turn their focus to the “how” of the content, focusing on the processes involved in each stormwater management technique and continue their annotation. In their third and final read, students focus their attention to the “when” of the content and complete their annotation. This assignment is one that students complete independently ahead of class using Schoology. Students are given a reading quiz to check their understanding and can use their notes from the close read as an aid.
Using Stormwater Models
Students use the stormwater runoff model from Figure 4 to study the impact of various management strategies and geographic conditions. The first tasks that students complete in this activity is to use a high resolution satellite image of the school property and surrounding neighborhoods to determine the percent of impervious surface cover. To do this, students are given the image and transparent grid paper with one square centimeter grids. They shade in areas of impervious cover and then calculate the percentage by dividing the number of shaded grids by the total number of grids and multiplying by 100. An alternative method based in the online geographic information system ArcGIS can also be used in this step. First, students find the school on the map. Next they use the measure feature to determine the total area. Then they specifically measure the area of individual impervious surfaces using the same tool and add up the total. Finally, they divide the impervious area by the total area and multiply by 100 as above. This percentage is used to determine the area where Qf = P, since all precipitation that lands on an impervious surface is assumed to runoff. The remaining area follows Qf = P – (ΔSm + ΔGw + ET + V). Students are given model data to determine the remaining variables and determine the baseline stormwater runoff. Then, students work in pairs to simulate the impact of specific green infrastructure techniques. This requires students to make judgements on decreases in impervious cover and changes to the remaining variables.
For all scenarios, the area of study totals 450,000 m2 and receives 4 cm of rainfall in a 24-hour period (which represents a typical summer storm in our area). That means in all cases the total volume of P equals 18,000 m3. Model values for each variable are as follows: ΔSm = 0.2P, ΔGw = .35P, ET = 0.05P, and V = 0.02P. For the baseline scenario (where impervious cover is approximately 20%), the workflow looks like this: Qf = 0.2P + [0.8P – (0.2P + 0.35P + 0.05P + 0.02P)], and Qf = 6,840 m3.
The scenarios that students groups are described below. For their assigned scenario, students must determine the reduction in impervious surface cover (if necessary), and make educated predictions on how the remaining variables are impacted by their change. By using the simulation at www.runoff.modelmywatershed.org, students can get reasonable values for each variable. Student Group A decides that a large grassy area adjacent to the school parking lot would be a good site for a large rain garden. Student Group B decides that a reasonable plan is to install permeable pavements on all roadways and parking lots in the study area. Student Group C decides that green roofs should be installed on all structures in the study area. Student Group D wants to install vegetated swales bordering all paved surfaces in the study area. If their scenario reduced the percentage of impervious surfaces (as in Student Groups B and C), students need to recalculate their initial coefficients as described in the Using Stormwater Models section above. Once students have altered all their variables to match their modification, they must calculate the value for Qf and determine the percent change between this value and the baseline value. Since each individual modification is likely to have a limited impact on reducing stormwater, students are tasked with using this information to quantify the impact of combining all of the treatments.
Planning for Stormwater Management in Southbridge and the Route 9 Corridor
In this activity, students use the knowledge from their stormwater modelling activity to develop a plan to manage the stormwater in the Southbridge neighborhood or along the Route 9 Corridor south of New Castle. Students are split into two groups, each tasked with studying one specific area. Since these groups are much larger than in the previous activity, each student must have one of the following specific roles: team leader, scientist(s), data processor, or communicator(s). The team leader is responsible for all communication with the teacher and moving the group along through each task. The scientist(s) is tasked with completing the scientific investigation (such as research into specific techniques, using ArcGIS, making predictions for specific variables in their model, etc. The data processor is tasked with using the information given to them by the scientist(s) to run the calculations in the stormwater model. The communicator(s) compiles the findings of the group and ultimately presents the findings of their group.
Students use www.modelmywatershed.org/analyze in a manner similar to the previous project to first determine the total area of study and impervious cover. By using the analysis features of this site, students can determine how much of the area is developed, what soil infiltration looks like, and mean sea level. They can then return to www.runoff.model.mywatershed.org to make educated predictions for values of ΔSm, ΔGw, ET, and V. They use the same rainfall event (4 cm in a 24-hour period) and their study area features to establish their baseline runoff data. Once their baseline is established, students can begin identifying areas where green infrastructure may reduce the environmental impacts of stormwater runoff. Students go through the same process from their previous activity to predict the impacts of specific treatments. In their planning, students are tasked with justifying their choices of treatments and where those treatments are located.
Once they have developed their plan, students can use the model feature of the site to test their plan’s effectiveness in both reducing stormwater runoff volume and improving water quality. To do this, students must redefine their study area and then select “Model.” They use the slide bar in the model to set precipitation to 4 cm. This provides a data set with values for Qf, ET, and infiltration (a combination of ΔSw and ΔGw), and concentrations of total dissolved solids, nitrogen, and phosphorous. By selecting “add changes to this area, students can insert rain gardens, vegetated swales, porous paving, and green roofs to the area and re-run their model to determine the impact of those changes. This provides them with the evidence they need to argue for their changes. It also provides a check to their own model and an opportunity to make changes to their plan if necessary. By taking screenshots of the site and their calculations as they work, student groups can compile the necessary materials to make a detailed presentation of their plan to share with their larger class community.
Answering and Scoring a Stormwater FRQ
Students conclude this unit by answering an FRQ about stormwater management in Southbridge in their FRQ notebooks. For this activity, students answer a question written by me that is modelled on FRQ number 2 as described in the Course and Exam Description, which asks students to analyze an environmental problem and propose a solution. The prompt they answer appears below.
The South Wilmington Wetlands Park is an urban constructed wetland designed to absorb stormwater runoff from the Southbridge neighborhood in Wilmington, Delaware. It is currently under construction and will be completed by the end of 2021. Prior to the construction of the wetland, the area suffered from frequent flooding during rain events. Water pooled on the streets in low-lying area and storm drains that fed into the Christina River overflowed as the traditional gray infrastructure was overwhelmed. The graph below shows the change in impervious surface cover and stormwater runoff in the neighborhood from 2000 to 2025. The numbers for 2025 are projected values based on the installation of the wetland.
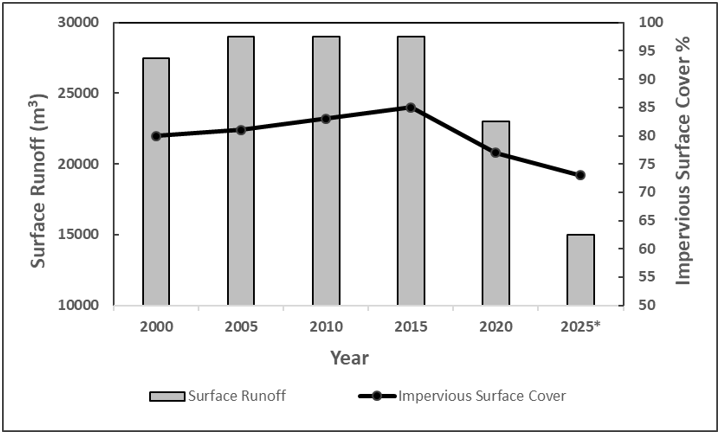
Figure 5: Simulated Runoff and Impervious Surface Cover for Southbridge, Wilmington, Delaware.
- Calculate the projected percentage change in stormwater runoff from 2000 to 2025. You must show all work to earn credit.
- Define gray infrastructure and identify two negative environmental consequences it has.
- Describe how a constructed wetland, such as the one being built in Southbridge, reduces the negative impacts of stormwater runoff.
- Define green infrastructure and explaining how it limits stormwater runoff.
- Describe two green infrastructure (excluding constructed wetlands) techniques that could be used to further reduce stormwater runoff in the Southbridge neighborhood.
After answering the question in their FRQ notebooks, students are given a printout of the rubric to grade their response. Then they trade with a peer complete the scoring process. If there is a discrepancy between scores, I help students identify where they did and did not earn points. The rubric includes the question, a point value, and a description of the answer(s) that would earn them those points. A description of that rubric follows.
Part a is worth two points, one for a correct set up and one for the correct answer: [(15000 m3 – 27500 m3) / 27500 m3] x 100 = -45%. Part b is worth three points. One point is awarded for correctly defining gray infrastructure as being designed to move stormwater away from the built environment. One point each is awarded for correctly identifying an environmental consequence, including localizes flooding, erosion of stream banks, alteration of stream/river hydrology, and transfer of surface pollutants into local surface water bodies. Part c is worth one point for correctly describing at least one of the following: slowing the flow of stormwater into local streams or rivers, promoting infiltration and groundwater recharge, naturally filtering out suspended solids, and biologically or chemically filtering out pollutants. Part d is worth two points, one for defining green infrastructure as being designed to mimic nature and capture rainwater where it falls, and one for explaining that it works by reducing, slowing, and filtering stormwater (must have all three to earn point). Part e is worth two points, one for each description of a green infrastructure technique, including vegetated swales, bioretention basins, green roofs, rain gardens, and permeable pavements.
Comments: