Content Matter Discussion
My school demographics is made up of a diverse group of people with roughly 44% White, 32% Latinx, 13% Asian, and roughly 11% other students of color. About 30% of the students at my school are socioeconomically challenged. Students at my school are, based on a cursory look at the data, fortunate to be attending a fairly successful school. Using data from the California School Dashboard one can see a graduation rate of 95.7% and a suspension rate of only 3%. (3)
Looking at bit harder at the data however, one sees a college and career readiness percentage of only 52%, declining 11% from the previous year. (4) What does this data mean? What other data could be used to evaluate this school and compare it to others? And does a review of the data suggest any positive changes or solutions? These are the questions that my students will be investigating and grappling with as they investigate education systems to learn about democracy and inequality.
In a modern democracy one might expect the courts to equalize schools (the promise of Brown v Board), or the government to step in (Congress?), or for people to vote for different and more equal and equitable policies (democracy and elections?). Using schools as an example, students in this unit will learn about the challenges of accomplishing positive change in our American democracy, and will learn how assumptions about relying on even a democratic government to equalize schools and other parts of society can result in disappointment.
The unit will be organized in the following manner. First, my students will briefly explore the vocabulary needed to create a common language and understanding. They will look at data about their own school and district, before expanding outward to look at data from other schools around the state and country. In their research students will be directed to collect data on schools in Philadelphia as well as other major cities around the country.
Philadelphia is chosen for a specific reason, since elementary students there are completing similar research. My students will be asked to share their findings with these students and will have the opportunity to mentor them and share additional data and culminating projects with them as well. In addition, my students will be asked to view presentations from the Philadelphia students as well. This extension activity will create an additional level of collaboration that will benefit both groups of students.
After this review we will discuss and propose several possible solutions that students can agree on. These will serve as the examples that guide us through a discussion about the challenges in implementing solutions. Once these challenges have been taught, students will again be asked to think about solutions, this time with a more refined effort. Finally, students will create presentations that highlight the problems of school inequality and propose workable solutions. Students will be asked what steps they themselves can take to help see these proposed solutions implemented.
Step One – Vocabulary
Students will begin the unit by looking at some vocabulary terms to create a common language. Most people believe that they know what terms like equity and equality are, what privilege and position are, until they start to discuss with others and look at specific examples. Rather than discover misconceptions down the road, students will begin by looking at and working with these terms and finding and presenting both examples and non-examples to each other.
Step Two – Data Collection, Analysis, and Challenges with Data
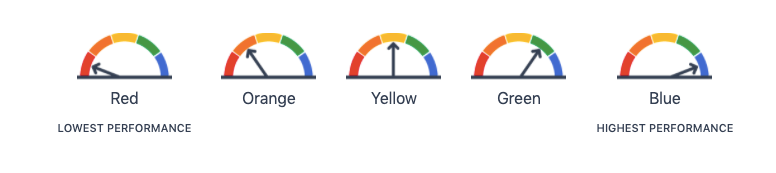
Students will begin to investigate their own school district, looking for inequalities that exist. One useful source of information here will be the California School dashboard, which breaks down school performance data into numerous color-coded categories that allow for simpler comparison of multiple schools. Students will be asked to investigate primarily high schools, but will glance at middle schools and elementary schools as well. At this point the focus will be within the district (San Jose Unified for my students) and students will compare and contrast the CA Dashboard categories uncovering and discussing any inequalities that exist.
During this investigation students will be given a list of schools to focus on that achieve the variety noted above. They will also be provided with an organizer that will direct them to specific pieces of information that need to be collected but also have some prompts built in that allow for independent thought and research.
In my own research preparing for this unit, I found that the high schools within my district are not equal based on the California Dashboard data. The basic color-coding of the dashboard is displayed below:
In looking at sampling of the high schools within San Jose Unified, one finds that there is a fair amount of variation. While graduation rates are uniformly high in most schools (blue or green), the college and career readiness indicators are not (orange). ELA and Math scores range from red to green, and the percentage of low SES students ranges from a low of 28% to a high of 80%. (5) This data is only a snapshot designed to illustrate what my students will be looking at, but it clearly shows unequal school performance within the same district.
In addition to these general ratings my students will also be able to drill down further into the data to see what additional details can tell them. For example, at one high school within SJUSD, the ranking for overall graduation rates is blue. However a closer look reveals that it is only blue for the white students. Asian and Latinx students, as well as low SES students have a yellow ranking, while students with disabilities are listed as yellow. (6) This data is available for all schools within the district and throughout California for 2019 (2020 data is not available due to the extenuating circumstance of the COVID pandemic and distance learning issues). The data shows that there are inequalities and inequities that exist within and between schools in California. One might ask why, and students will be prompted to think about and address that question as well.
Students would then expand the investigation to other districts in California and continue their comparisons. This would be done by assigning students to investigate other specific schools and districts within the state using the California Dashboard. By using the same source, the data will be similar in scope and type so useful comparisons can be made. Students will be assigned districts from a variety of geographic areas within the state. They will research not only the school district information but also details such as geography, population numbers and demographics, and community involvement. The information that they uncover can then be measured and examined and discussed.
For this part of the unit, I will have students working in small groups divided by geographic area, or suburban v urban, or other logical separation criteria. As students begin to collect and analyze data they will be asked to create a visual display of their specific area that can be presented to classmates. These presentations will include not only the Dashboard and demographic data but also their interpretation and analysis, and support for their conclusions.
Additional questions that students will consider at this point include: What is the cause of school inequality? Which districts have more resources and why? Do local elections play a role and if so, what? Which districts have community support in the form of bond measures, parcel taxes, etc. and why? What about educational foundations that raise additional money but are not present in all districts? What other inequalities exist in the district boundaries that contribute to the issues (housing, employment, population density, and more). Students will learn more about property taxes and school funding later in the unit, which will clarify some of these questions for them.
Once students have compiled and analyzed their data about California they will turn their attention to schools around the United States to gain a wider perspective. Is school inequality just a California issue? Or a state-by-state issue? Or is it a national issue? For this next phase of the investigation students will use data compiled and presented by Adam McCann in their article titled “States with the Best and Worst School Systems” and published on the wallet hub website referenced below in the bibliography.
In the McCann work all fifty states are given an overall numeric score and then also given a separate quality and safety rank. In addition, McCann creates a number of different categories (dropout rate, teacher – pupil ratio, academic scores, etc.) and lists the top and bottom states for each. Students will investigate where California ranks and then look at some of the other states as well, again driven by category for comparison. Some potential questions to ask include do smaller states fare better or worse, what does population and population density mean, if anything, and are there regional patterns that emerge?
Once students have this mountain of data the question becomes what to do with it. What does this data tell us and can one really accurately compare schools in SoCal v NorCal, Philadelphia v San Jose, or Maine v California?
To answer these questions students turn again to Professor Deaton as he describes the challenges of comparing and measuring economic well being in different countries and making the apples to apples comparisons rather than the apples to oranges comparisons. Although my students are evaluating school data and not economic data, it will still be instructive for them to think about the challenges of measurement at this point.
Deaton discusses a number of challenges that I believe would be useful for students to consider. First he asks why people don’t simply move from poor countries to rich countries to better their economic position. One could easily ask the same about school districts and my students and I will consider these issues and discuss some examples together. (7) In this part of the unit we will look at the challenges of changing schools including the costs of private schools, the admission challenges of charter schools, the availability of schools districts, etc.
Deaton then talks about the challenges of measurement in general using consumer prices as his example. According to Deaton if one wants to compare the international price of men’s dress shirts one could choose a Brooks Brothers dress shirt that is easily available in New York City. But is that same style and quality of dress shirt going to be available in other cities around the world such as Bolivia, the DRC, or the Philippines? If it is, perhaps it is only available in a very high-end shop catering to the rich, which would overstate the price of that shirt in those countries. If it is not, then one has to find the closest available shirt, which might be less expensive due to different manufacturing, or quality issues, which then understates the price and also complicates the comparison. (8) Can this same challenge be seen in trying to measure and compare school districts and if so, then what are the trade offs and considerations that one must be aware of before making a move?
Deaton goes on to note that some items are so customized to their location that comparison of prices across international borders are impossible. He notes that “Teff is the basic grain staple in Ethiopia and is rarely used anywhere else; tofu is important in Indonesia but not in India; alcohol is not available in many Muslim countries.” (9)
Our school comparisons can take on many of these same challenges. In looking at technology in the classroom, for example, what constitutes apples to apples comparison? During my first years of teaching I shared an old computer cart with a colleague. My students did not have full time access and the units were already obsolete and damaged after three years of use. During this same time period I had a student visit a private High School that they hoped to attend. They excitedly came back the next day letting me know that their potential new school allocated new Ipads to all students. Several years later, I received my own brand new computer cart dedicated to my students with all new devices (except the cart held 30 computers and my roster size was typically 34). All of these are examples of technology in the classroom but they hardly seen equal or equitable and cannot be easily measured as like objects.
Step Three – Challenges on the Road to Equality
After students have examined the available data and stepped through the analysis described above, I will guide them through discussions that arrive at a consensus on one or two possible solutions. There will be more learning and discussion and more focus on possible solutions later in the unit, but for now we will use these initial solutions to discuss and illustrate the challenges and roadblocks that one might encounter in trying to implement equalizing solutions in a democracy.
The Courts or Congress?
No discussion of school equality would be complete without some reference to Brown v Board of Education. Students that have only a surface level understanding of what Brown did and did not accomplish might tend to overstate the importance of the decision and its impact on equal schools. After all, the Supreme Court ruled that separate is not equal and that schools should integrate, then they did. Right?
The story is not quite that simple, and in his work titled “The Hollow Hope” University of Chicago political science professor Gerald Rosenberg discusses at great length the impact that the Supreme and other courts have had on landmark changes to society in the United States, including the Civil Rights movement and education.
Looking at Rosenberg’s data and argument will allow my students to see and evaluate a different perspective on Brown than they have likely seen before. The author’s data shows the number of black students in secondary schools with white students from the years 1954 through 1972. He contends that if the Brown court decision was the starting point for school integration than the numbers should rise shortly after 1954. They do not. The number of black students in classrooms with white students in the South in 1955 – 1956 is .12% of the total. By 1964 – 1965 (ten years after Brown) it has risen to only 2.3% of the total. An increase to be sure, but Rosenberg makes his point by looking at what the numbers do after 1964.
After 1964 (and the passage of the Civil Rights Act) the numbers increase to 6.1% in 1965-1966 and increase to 16.9% in 1966-1967 after passage of Elementary and Secondary Education Act which provided Federal aid to school district with large numbers of low income students. By 1968-1969 the percentage had almost doubled to 32% and continued to rise in the years for which Rosenberg presents data. (10)
What I want my students to think about then is whether it was the Court action or the new laws that actually desegregated schools. Additionally was it the money (from ESEA) that really did the trick? Rosenberg contends that it was the legislative action, and I’m curious to see if my students will agree with him. Whether they do agree or not, this example will show that relying on or waiting for the Courts to act is perhaps not the best strategy for social change such as equalizing schools.
To give students more to consider and to keep them engaged, they will also review a court case involving their own school district, Diaz v. San Jose, 1986. In this case the plaintiffs maintained that the district was maintaining segregated schools and sued the school district for relief starting in 1971. After several rulings in favor of the district the plaintiffs did eventually prevail, though the process took many years. Students will review the facts and timeline of the case, look at the relief actions that were mandated, and then consider the current status of the schools in this San Jose district. Are they, in fact, still segregated and why?
Elections
So if court action through Brown was ineffective and Congressional action was more effective, does that mean that society should rely on elections and Congress to equalize schools? According to Princeton professor Christopher Achen and Vanderbilt professor Larry Bartels in their book “Democracy for Realists” the answer is again, no.
Achen and Bartels talk about several obstacles to real change coming from elections in a democratic society. These include issues with voter knowledge and preparation, the framing of questions when issues are put in front of voters, and the challenge of finding representatives that are actually responsive to the people that vote them into office.
The authors use a number of statistics to chart the general knowledge of the average voter. They cite a number of studies to contend that in the United States in the 1950s only about 44% could name at least one branch of government. In the early 1970s the number of Americans with knowledge about the Watergate scandal was only at about 20%. In the mid-1980s only roughly 60% knew if their governor was a Democrat or a Republican. Students will look at this information and more. (11)
One might assume that in today’s information age of twenty-four hour news and ready Internet access that the voter of 2021 would be more informed that the voters in the above referenced numbers. What the authors contend, however, is that while the variety and volume of political news had increased the level of political knowledge that the average voter holds has not.
Another challenge in relying on voters and elections to make changes in society comes in trying to discern what voters want. Achen and Bartels note that the way in which a question is worded can often produce different results. They give several examples, including on from the early 1990s when the United States was about to begin military action in response to Iraq invading Kuwait. When asked if supported ‘military force’ roughly two-thirds agreed that they did. When asked if they were willing to have the U.S. ‘engage in combat’ fewer than half said they did, and fewer than one-third were willing to ‘go to war.’ (12) From this data we can see that ascertaining the consensus of the population can be difficult and the manner in which questions are asked can make it even more so.
Still another challenge in relying on elections to drive positive changes in society is embedded into the very nature of representative democracy. While politicians may try to determine the mood and consensus of their voters during an election, once put in office there is no immediate mechanism for accountability until the next election. Achen and Bartels note “Democrats and Republicans routinely take very different stands once they are elected, even when they represent states or districts with very similar views.” (13) While some might credit this phenomenon to the dramatic polarization present in today’s politics in the United States, the authors take care to note that this pattern can be found in congressional voting records going back at least 140 years. (14)
Societal and Institutional Challenges
One of the other challenges that one will run into in trying to equalize schools through voting and elections is the attitudes and actions of the voters themselves. One cannot assume that all voters will support an effort, or the same effort to make a change. One of the specific challenges in school equalization efforts is the manner in which schools are funded at the local level. Racially segregated and gerrymandered districts contribute to the difficulties of getting meaningful reform enacted. Attitudes towards property taxes in general have a direct impact on school funding and can also muddy the ‘local funding’ waters.
In California history perhaps no other decision by the voters has had the outsized impact that Proposition 13 has had. Not only did it limit the amount of property tax money available to California schools but also triggered the need for additional funding from the State, reshaping the idea of local control, and it created a ripple effect of taxpayer revolt that spread across the country. It is perhaps an ideal example of how democracy and inequality often go hand in hand.
Using direct instruction students will create a ‘Prop 13 Cheat Sheet’ that will outline the basic components that were enacted by voters in 1978. These components include the 1% cap on residential and commercial property taxes and the 2% growth cap, which creates properties that are taxed well below their market values. Prop 13 also created a supermajority requirement for any new taxes to be created, setting the bar at a two-thirds majority. While these measures created savings for homeowners they have reduced local revenue available for funding schools and other public services. (15)
After students have learned the basics, they will again refine their research skills by investigating the effects of Prop 13 both locally and around the country. Using data provided by CALmatters (a nonpartisan and nonprofit California news organization) and several California public broadcasting services students will be able to see the effects of Prop 13 in a variety of local California settings, including their own neighborhoods. For example, in looking at the neighborhood that their school is in students will see that the total tax revenue lost under Prop 13 exceeds $1.5 million dollars. (16) Again, while that represents a savings for individual taxpayers it represents a loss of funding for schools and other public services. Students will then do research on efforts in other states that were or are similar to Prop 13, looking for relatable and comparable information to present to each other.
Another dilemma when considering property taxes and school funding lies in the unequal manner in which properties in different areas get assessed. The New York Times editorial board discusses this in an article published on April 4, 2021 titled “An Unfair Property Tax System.” In is, the board notes that a disturbing pattern is present – more valuable properties tend to get undervalued (therefore the taxes are lower) while less valuable properties get overvalued (increasing the tax burden). They note that this effectively gives a de facto tax break to wealthy individuals, and that “Nationwide, from 2007-2016, homes in the bottom 10 percent of property values in a given county were taxed, on average, at an effective rate that was twice as high as the rate for homes in the top 10 percent…” (17)
Assuming that the Times assertions are correct, this makes school funding more expensive per property for lower income districts and creates inequality in other public services as well. Lower income homeowners are paying a larger percentage of their income in property taxes than would be required of families in wealthier districts. This leaves less money available for discretionary spending, which might explain discrepancies in voluntary support for schools, which will be examined below.
Here is another opportunity for my students to gather and analyze data. Property values should be public records, and students can be provided with some targeted areas to examine. Also writing in the New York Times Emory University Law Professor Dorothy A. Brown discusses the challenges of ongoing systemic racism in the form of long lasting effects of redlining.
Writing in May of 2021 Professor Brown asserts that when Black families choose Black or racially diverse neighborhoods in which to raise their children they inevitably face underfunded schools due to the lower taxes that low property values in these neighborhoods generate. Brown notes that typically most home values are set by the large numbers of White buyers who prefer to live in White areas, driving up those home values, and the taxes they generate, by comparison. (18) This disparity in home values in the differing neighborhoods creates unequal schools, since schools rely on much of their funding from the property taxes paid by homeowners.
Not only will the amount of money available to a school district vary because of how property values are assessed and because of property values, but many residents of the community will also protest increases in spending to benefit other people instead of themselves. According to Rutgers political science professor Michael K. Gusmano the decades of public policy that promoted home ownership for whites while simultaneously denying the same opportunity for people of color has created a residential segregation that makes cooperation towards the ‘common good’ difficult if not impossible. (19)
In thinking specifically about schools, Gusmano notes that residential segregation “encourages White citizens to think of non-White populations and not legitimate members of society or recipients of public goods.” (20) Because of this, it can be reasonably concluded that White neighborhoods will not vote for increased taxes or new bonds that would provide equalizing materials or other support for schools in non-White neighborhoods. This increases the challenge of equalizing schools through elections and elected officials.
In addition the issues that segregation raises, Gusmano also discusses the problem that voters have getting the attention of their elected officials, echoing the arguments of Achen and Bartels. He blames the practice of drawing political districts that favor one party over the other, or gerrymandering, for creating state legislatures that put the interests of party over the interest of the public good and democratic fairness. (21)
Examples of Previous Attempts to Equalize/Reform Schools
One of the components that I want to be sure to include in this unit for my students is some discussion about what school improvements have been attempted before and how have they fared. Examples can be found in Washington Post education reporter Dale Russakoff’s book “The Prize.” The prize refers to the amount of money spent annually by the Newark, New Jersey school district and the race to see who can control and benefit from that spending. Russakoff specifically chronicles the attempts of Mark Zuckerberg, then Mayor Cory Booker, and then Governor Chris Christie to manage a $100 million dollar gift that Zuckerberg gives to the Newark schools.
Several parts of the book serve as specific examples for my students about what types of school improvements work better than others. These include a teacher led effort at the Avon Avenue School and a comparison of both a district school and a charter school co-located at Carver Elementary. In this phase of the unit students will again be divided into groups and then assigned one of the two examples to read about. They will be given time to process and discuss the information in the text and then also required to do their own supplemental research as a group. Once finished, groups will present to at least two other groups, teaching the content to their classmates.
The Avon Avenue School was, according to Russakoff, one of the worst performing schools in Newark. A group of teachers within the school began a process of taking over the school and revamping the curriculum for their students. Because they were already at the school, they were already well versed in the challenges that their students faced on a daily basis and promoted a solution that addressed the issues “child by child, teacher by teacher, school by school, from the bottom up.” (22)
The teachers there spent about a year and a half researching different types of strategies and visiting other, similar schools, including charter schools. Although charter school leaders were eager to help this team from Avon they instead wanted to solve the problems from within the public school. According to Princess Williams, one of the teachers at Avon, “My calling is to fix the public schools…if something is broken and we have the power to fix it, why would we abandon it for something else? (23)
Named Building Responsible, Intelligent, Creative Kids, or BRICK, the team at Avon created a proposal with the approval of the Superintendent. They wanted to start small and build, but were instead handed the entire school to reform along with the teachers in the existing staff. Russakoff notes that these were the same teachers that had been delivering subpar results all along, but the team’s desire to work within the public school system meant that they had little choice over the staff at their school, unlike a charter school, which enjoyed more freedom of choice in a non-union setting. (24)
In attempting to create an improved environment the BRICK team focused on observing teachers and helping them to improve along with improved relationships and communication with families, through an individualized plan for each student that included specific goals and tasks to be done and supported at home. They asserted that effective teachers were the answer to most behavior issues, “…teachers who captured and held children’s attention through a combination of strong pedagogy, empathy, and leadership.” (25)
While the BRICK team at Avon deliberatively stayed away from becoming a charter school, there were multiple charter schools started in the Newark school district during the time the BRICK team was working. At Carver Elementary there was a charter (Spark Academy) co-located with the preexisting public school, and a comparison of the two sheds more light on the challenges faced by the public schools.
The first difference noted concerns the teaching staff. Carver, according to the author, had for years been a dumping ground for weaker teachers that no other school wanted. Spark, by comparison, was able to recruit their teachers nationally and hand pick them. (26) Not only was the quality of staff unequal but the deployment of staff was as well. Spark had 520 students that were served by two full-time social workers and another that worked half time. Larger district schools typically had only one social worker, sometimes two. (27)
Another staff related difference that is worth noting is that District teachers were unionized, while the charter schools used non-union teachers. This allowed for much greater flexibility in how money was allocated for teacher resources. Belcher, the Principal at Spark was able to customize her staff to meet the needs of students. She put additional teachers in the lower grade level classes and created smaller separate classes for students that were struggling. Carver, by contrast, had one teacher in each classroom regardless of any individualized needs that may have arisen. (28)
Spark also had the ear of Mayor Booker, who promised individualized help and attention, Carver did not. One example cited notes a row of old and crime ridden abandoned houses that sat across the street from the school. The houses had stood empty for years without anyone from the city noticing or taking any action, yet Booker promised to “put my director of neighborhood services on it.” When asked by the Spark administration what his plan was to improve Carver for its students the response was that “…when schools are failing, I don’t think putting new wine into old skins is the way. We need to close them and start new ones.” (29) Clearly attending to students in existing schools that needed the same, if not more help was not as exciting for this Mayor as helping the newer shinier charter schools was. The existing schools were fighting long standing institutional neglect in a way that the newer charter schools did not.
Comments: