Classroom Activities
I will introduce this curriculum unit to students with coins, visuals, videos, articles, and websites about the U.S. coins. Here is a list of materials and helpful resources I expect to use: Fake and real U.S. coins, paper copies of coins, magnifying lens, rulers, chart paper, notebooks, books on the history of U.S. coins, and the U.S. Mint’s webpage: https://www.usmint.gov/learn/kids.
U.S. Coin History and Observation
For the 1st group of lessons, I will have students work in pairs to observe real pennies, nickels, dimes, quarters (optional: half dollar coins and dollar coins) with the chart below (Figure 3: U.S. Coin Specifications). I will have students refer to https://www.usmint.gov/learn/kids/coins-life/parts-of-a-coin (Parts of a Coin), https://www.usmint.gov/learn/kids/resources/coloring-pages (Coloring Pages), and/or use a magnifying lens to see the magnified details of each denomination. Below is a short list of probing questions I expect to use during this activity:
- Why are coins in the shape of a circle? (Easier to roll and use).
- Does the edge of a coin feel smooth (pennies) or rough (quarters)?
- Why is the rim of a coin raised? (Protect design and allow coins to stack)
- What is written on the head (obverse) and the tail (reverse) of a coin?
- Why words or phrases like “Liberty”, “In God We Trust,” “E Pluribus Unum,” and a mint mark (D, P, S, or W) are inscribed on the coin you are observing?
Research Project on U.S. Coin History:
Quarters are excellent tools for students to start their research about U.S. History. I will have students work in pairs to write a report about the history behind one of the quarters that honor an individual or a national park. Here are a few webpages to get the research started:
- https://www.usmint.gov/learn/coin-and-medal-programs/american-women-quarters
- https://catalog.usmint.gov/coins/coin-programs/american-innovation-dollar-coins/
- https://parksexpert.com/national-park-quarters/
- https://www.usmint.gov/learn/coin-and-medal-programs/50-state-quarters
|
U.S. Coin Specifications for Student Observations and Notes |
||||||
|
Denomination (Coin Name) |
Penny |
Nickel |
Dime |
Quarter |
Half-Dollar |
Dollar Coin |
|
Obverse (Head) |
Washington |
|||||
|
Designer/Sculptor |
Fraser/Fraser |
|||||
|
Reverse (Tail) |
Bessie Coleman |
|||||
|
Designer/Sculptor |
Damstra/Gordon |
|||||
|
Color |
Silver |
|||||
|
Material Composition |
8.33% nickel, balance copper |
|||||
|
Weight |
5.670 grams |
|||||
|
Diameter |
0.95 in./24 mm |
|||||
|
Radius |
0.475 in./12 mm |
|||||
|
Edge |
reeded |
|||||
|
Place of Mint |
San Francisco |
|||||
|
Mint Mark |
S |
|||||
|
$ Notation |
$0.01 |
$0.05 |
$0.10 |
$0.25 |
$0.50 |
$1.00 |
|
¢ Notation |
1¢ |
5¢ |
10¢ |
25¢ |
50¢ |
100¢ |
|
Decimal Fraction |
1/100 |
5/100 |
10/100 |
25/100 |
50/100 |
100/100 |
|
# of coins to make $1.00 |
100 pennies |
20 nickels |
10 dimes |
4 quarters |
2 half-dollars |
1 dollar coin |
|
Additional Observations, Drawings & Notes |
||||||
Figure 3. The above chart will help students as they explore the coin specifications for the penny, nickel, dime, quarter, half-dollar and dollar coin.
Decimal Fractions
For the 2nd group of lessons on decimal fractions, start with a quick pre-assessment called Decimal Comparison Test.21 The purpose is to diagnose how students are thinking about decimal notations; it is a quick, easy, and revealing way to assess what students know. The original test was part of a study from the University of Melbourne, and it asked each student to simply choose the larger decimal number. The research study concluded that only about half of 900 students understand whole number place value well and many of them understand the place value of decimals even less.20 Some children misinterpret decimals by making false analogies with whole number concepts. The most common sources of confusion are with money, sport, and remainders in division. Other misconceptions include: longer-is-larger whole number thinking; shorter-is-larger thinking; zero-makes-larger thinking; left to right comparison while ignoring place value.
Below is a similar test that I constructed based on the original study. Here students are asked to use the mathematical symbols >, < or = to correctly complete the comparison. I would use the following approach for a class period of 45 minutes. For the first try, I would give students 5 minutes to quickly complete as many comparisons as they can. After the initial assessment, I would group students in pairs for a 2nd try, and give them 10 minutes to discuss and rework their answers. For the 3rd try, I would group the two pairs into a group of four students, and give them another 10 minutes to compare their answers and discuss any discrepancies. For the remaining class period, I would gather students into a whole group for a reflective closure, and ask each group to share one misconception that they were able to spot and correct it together.
|
Direction: Below are 30 pairs of decimals. For each pair of decimals, write the correct symbol >, < or = to complete the comparison. |
|||||
|
1. |
0.5 ____ 0.457 |
11. |
1.053 ____ 1.06 |
21. |
4.4502 ____ 4.45 |
|
2. |
0.86 ____ 1.3 |
12. |
4.08 ____ 4.7 |
22. |
17.350 ____ 17.35 |
|
3. |
0.300 ____ 0.3 |
13. |
3.72 ____ 3.073 |
23. |
8.24 ____ 8.2456 |
|
4. |
1.85 ____ 1.84 |
14. |
2.621 ____ 2.068798 |
24. |
3.2618 ____ 3.26 |
|
5. |
3.67 ____ 3.76 |
15. |
8.0526 ___ 8.056 |
25. |
0.350 _____ 0.035 |
|
6. |
4.8 ____ 4.63 |
16. |
5.62 _____ 5.736 |
26. |
2.186 _____ 2.954 |
|
7. |
0.03 ____ 0.0300 |
17. |
0.5 _____ 0.75 |
27. |
0.872 _____ 0.813 |
|
8. |
0.75 ____ 0.8 |
18. |
0.426 ____ 0.3000 |
28. |
0.006 _____ 0.53 |
|
9. |
0.37 ____ 0.216 |
19. |
2.516 ____ 2.8325 |
29. |
3.741 _____ 3.746 |
|
10 |
3.92 ____ 3.4813 |
20. |
7.942 ____ 7.63 |
30. |
0.038 _____ 0.04 |
Figure 4. Decimal Comparison Assessment: Students will compare 30 pairs of decimals.
Decimal Points and Place Values
When teaching decimals, I would make sure students understand the purpose of a decimal point by asking them guiding questions, and then give time discussion time to think-pair-share. Possible answers: A decimal point separates the whole number from the fractional part; acts as “a point of reference” between the ones and tenths place; the right side of a decimal point represents value less than one whole. Below is a short list of videos that explain decimal place value, conversion of decimals into fractions:
- https://www.youtube.com/watch?v=KG6ILNOiMgM on decimal place value
- https://www.youtube.com/watch?v=_jcW-ZgpRbM&t=209s on decimal fractions
- https://www.youtube.com/watch?v=do_IbHId2Os on convert any fraction to a decimal
|
1 |
1. |
1.0 |
1,000 |
1.00 |
|
10. |
100. |
0.1 |
0.01 |
0.001 |
Figure 5. I would use the above decimals to discuss what are the place values of the digit 1.
Here are some guiding questions I expect to: What is the greatest value of the digit 1? What is the least? Is the decimal 0.1 greater or less than 0.01? (Greater since 0.1 = 10 x 0.01). How many tenths are needed to make one? (10 because 10/10 = 1) How many hundredths are needed to make one whole? (100 because 100 divided by 1/100 = 1) How many thousandths are needed to make one? (1,000 because 1,000 x 0.001 = 1).
One common misconception when multiplying by 10 is teaching students the “tricks”: the decimal point moves one place to its right (when multiplying by 10) or to its left (when dividing by 10). First of all, the decimal point NEVER moves. I would have students visualize the decimal point like a fixed column in a building that always stands between the ones and tenths place. The mathematically correct explanation is: the digits slide one place to the right when multiplying 10, and slide one place to the left when dividing by 10.
Another misleading “trick” is: when multiplying by 10, add a zero to the end of the number. Again, the trick works with whole number, but not with decimals or fractions. For instance, 5 (a whole number) x 10 = 50, but 0.5 (a decimal) x 10 does not equal to 0.50. For a fraction, this trick (for multiplying by 10) works when you add a zero to its numerator, but fails when you add to a zero to its denominator. For example: ½ x 10 = 10/2 or 5, but 1/2 x 10 is not 1/20.
I would use a decimal slider (see this video https://www.youtube.com/watch?v=lucM3lR04nc) or a place value chart (see below) to show how the digits slide one place to its right when multiplying by 10, two places when multiplying by 100, three places when multiplying by 1,000. I would also have students practice writing the multiplication or division equations to visualize and explain their reasoning. For instance, 0.5 x 10 x 10 x 10 x 10 = 5,000 and not 0.50000.
|
Whole Number and Decimal Place Value Chart |
||||||||
|
1,000s |
decimal comma |
100s |
10s |
1s |
decimal point |
1/10ths |
1/100ths |
1/1000ths |
|
103 |
102 |
101 |
100 |
10-1 |
10-2 |
10-3 |
||
|
thousands |
hundreds |
tens |
ones |
tenths |
hundredths |
thousandths |
||
|
5 |
, |
5 |
5 |
5 |
● |
5 |
5 |
5 |
|
=5000 |
=500 |
=50 |
=5 |
=0.5 |
=0.05 |
=0.005 |
||
|
Below is an example multiplying by 10 (123.45 x 10 = 1,234.5) where each digit will move one place to the right. The digit 1 moves to the thousands place (left of the decimal comma), the digit 2 moves to the hundredths place, the digit 3 to moves to the tens place, the digit 4 moves to the ones place (left of the decimal point), and the digit 5 moves to the tenths place |
||||||||
|
1 |
2 |
3 |
● |
4 |
5 |
|||
|
⬅1 |
⬅2 |
⬅3 |
● |
⬅4 |
⬅5 |
|||
|
1 |
, |
2 |
3 |
4 |
● |
5 |
||
Figure 6. Decimal place value chart and an example of 123.45 x 10 = 1,234.5
Decimal Grids in Ones, Tenths, Hundredths, and Thousandths
When transitioning students from whole numbers to decimals and fractions, I find it critical to discuss how manipulatives like the 3-dimensional base-10 blocks and visual model like a 2-dimensional hundreds grid (where one unit is 1, one rod is 10, one flat or a hundred grid is 100, and one block is 1,000 units) are used to represent whole numbers. Even though the same manipulatives and worksheets are suitable to represent decimals or decimal fractions, there is one major change: a flat (like a hundred or hundredth grid) is now a whole or 1 like a dollar that is equivalent to 100 pennies, a rod now represents 0.1 or 0.10 which is equivalent to a dime or 10 pennies, and a unit has changed to represent 0.01 or a penny. Most importantly, a block of 1,000 is not 0.001 but has changed to represent 10 flats or 10 dollars which are equivalent to 1,000 pennies. In addition, a thousandth grid has 1,000 units of 0.001, and therefore, a thousandth grid is actually one whole, that is equivalent to a hundredth grid, a tenths grid, or one grid. For my own teaching experience, I have not seen a math lesson that clarify this major shift, but have seen many students struggle with this major change.
I will explain this major change of representation with blank tenths grids, hundredth grids, thousandths grids, decimal number lines, decimal place value charts, as well as worksheet drills on decimal expanded notations, rounding, comparing, conversion of decimals and fraction, addition, subtraction, multiplication and division. Below is a short list of resources.
- https://www.math-drills.com/decimal.php#decimal-grids-charts
- http://www.decimalsquares.com/Repromateri/
- https://curriculum.illustrativemathematics.org/k5/teachers/grade-5/unit-5/lesson-2/lesson.html
To facilitate this shift to use a hundred grid as a hundredths grid, I find it critical to have students explain why decimals such as 0.8 and 0.80 are equivalent, but 0.8 is not equivalent to 0.08. For the equivalence of 0.8 and 0.80, we should observe that both have 8 in the tenths place; extra zeros to the right do not change the value. The zeroes in $0.80 need to be taught explicitly where the digit 0 in the ones place represents zero dollar, the digit 8 in the tenths place means 8 dimes, and the digit 0 in the hundredth place represents zero cents. Therefore, the decimal 0.8 is equivalent to 0.80 = 0.800 = 0.8000 and so on. For non-equivalence of 0.8 and 0.08, we can argue that $.80 is eighty cents, while $.08 is only eight cents. I would use guided instruction (whole or small group) to have students compare these decimals in the following ways:
- Draw a number line from 0 to 1 with 10 equal partitions (intervals of 0.1 or 0.01), and label the locations of the decimals 0.80 and 0.08.
- Use a tenths (10 x 1) grid to shade 0.8, and a hundredth (10 x 10) grid to shade 0.08. Ask students to explain how they shaded their grids to describe any similarities and/or differences. Then reverse the decimals: Use a tenths (10 x 1) grid to shade 0.08 and a hundredth (10 x10) grid to shade 0.8.
- Use quarters, dimes, nickels, and pennies to show the values of 0.80, 0.8, and 0.08. I will have students to draw circles to visually represent the value, and label a quarter with the letter Q or 25¢, a dime with D or 10¢, a nickel with N or 5¢, and a penny with P or 1¢.
Guessing Jar of Coins
I would set up a jar of fake coins of different denominations for students to guess the total dollar amount once a month. This webpage https://www.supercoloring.com/paper-crafts/set-of-usa-coins-printable-template#gsc.tab=0 has coin illustrations that teachers can make paper copies for students to cut out. I would use different colors of paper for different denominations. If the class decide to use real coins, the guessing jar can serve as a donation jar at the end of the year. I would visit the website https://coinstar.coV/charitypartners/ and enter our zip code after clicking “Find a Kiosk” to allow students to choose a class charity. Charity programs such as “The Coinstar Coins that Count” will donate the coins directly to a participating charity such as the American Red Cross, Feeding America, Make-A-Wish Foundation of America, NAACP, UNICEF Relief Fund, and the World Wildlife Fund.
To help students to estimate more precisely, I will have students work together to figure out different ways to make one dollar and make a collaborative poster of visual representation. I will challenge students with the fact that there is a total of 293 ways to make a dollar with only quarters, dimes, nickels, and pennies! The following video explains and illustrates different ways to make a dollar with different coins: https://www.youtube.com/watch?v=dU0adeaEjIY&t=13s. Additional prompts for student inquiries:
- Make a total of $1.20 (any amount greater than $1.00) with as many ways as you can with dollar coins, half-dollar coins, quarters, dimes, nickels, and pennies.
- Make a total of ____________ with the fewest number of coins.
- Make a total of ____________ with only dimes, nickels, and pennies.
Make a total of ____________ with the greatest number of coins.
|
Example #1 |
Example #2 |
|
If x = the dollar value of a nickel, and y = dollar value of a dime, what is the dollar value of z? What would be the name of this U.S. coin? |
If x = the dollar value of a dime, and y = dollar value of a nickel, what is the dollar value of z? What would be the name of this U.S. coin? |
|
3x + 4y = 2z 3($0.05) + 4 ($0.10) = 2z $0.15 + $0.40 = 2z $0.55 = 2z $0.55/2 = 2/2z $0.275 = z |
3x + 4y = 2z, 3($0.10) + 4 ($0.05) = 2z $0.30 + $0.20 = 2 z $0.50 = 2 z $0.50/2 = 2/2 z $0.25 = z |
|
Answer: z is not a possible U.S. coin that worth $0.275 |
Answer: z is a quarter 3 dimes + 4 nickels = 2 quarters |
Figure 7. The above chart shows two examples with the algebraic equations 3x + 4y = 2z using coins such as nickels, dimes, and quarters as units of measurement.
Decimal of the Day
I will write the phrase “Decimal of the Day” on a graphic organizer or a chart paper posted in the classroom. Example of a Decimal of the Day: 3.095. This activity will be a routine at the beginning or ending of a math lesson. Students will complete selected items from the list below. I will provide an assignment sheet with all the tasks listed below at a later date:
The Decimal of the Day (DotD) is 
- Write DotD as a decimal fraction: ____________________________________________.
- Write three equivalent fractions: _____________________________________________.
- Write DotD in word form: __________________________________________________.
- Write DotD as an expanded form: ____________________________________________.
- Add DotD to: ______________ Write the addition equation: _______________________.
- Subtract DotD from:_________ Write the subtraction equation: ____________________.
- Multiply DotD by:___________ Write the multiplication equation: _________________.
- Divide DotD by:____________ Write the division equation: ______________________.
- Compare DotD to: __________ Write the comparison: ___________________________.
- Represent DotD with the least number of coins.
- Represent DotD on a number line.
- Represent DotD with a tape diagram.
- Represent DotD with a hundredth grid.

Figure 8. The above chart shows the decimal fractions 1/100, 5/100, 10/100, 25/100, 50/100, 100/100 using grids in tenths, hundredths, thousandths as well as fourths, halves, and a whole.
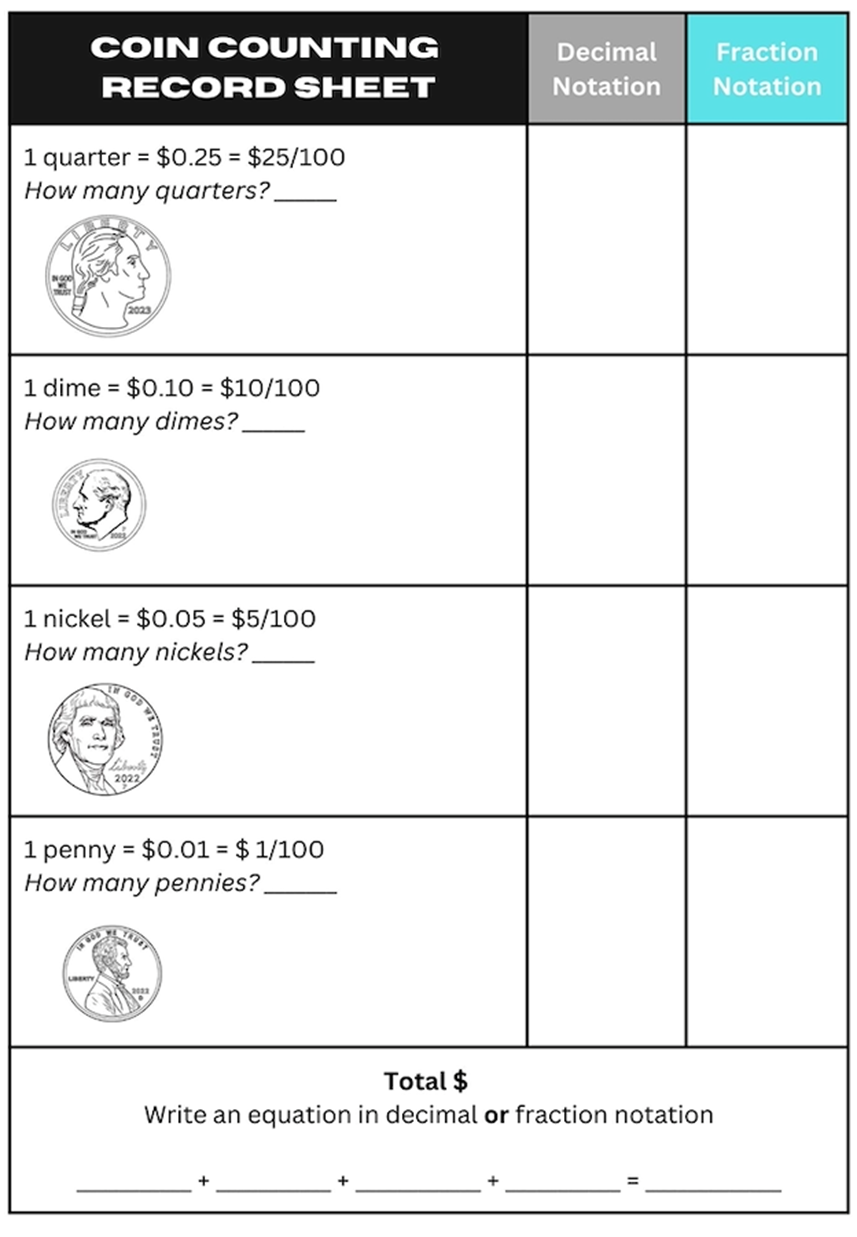
Figure 9. Above is a record sheet for students to count the number of coins in their guessing jar. Students can practice how to convert decimals into fractions.
Accordion Books Using Number Lines and Tape Diagrams
It would be helpful for students to have a large number line with equivalent decimals like 0.3, 0.30, and 0.300 (all at the same place on the number line) to show equivalence among decimals, fractions, and percentages. Because a large classroom number line can be cumbersome and/or inflexible, sometimes I will present this challenge in the following way:
I will use the format of an accordion book to make a large classroom number line; this would allow space to add more numbers, and write labels with explanations. This way the large number line can be easily folded back into a manageable book. In addition, students can easily make mini-number lines and staple them to their notebooks. Tape diagrams are similar to number lines, but give a qualitative way to represent and visualize calculation. A tape diagram is a visual model in the shape of a rectangle resembling a piece of tape. It is used to assist students with the calculation of addition, subtraction, multiplication, and division. It is also known as a divided bar model, fraction strip, length model or strip diagram. See the following sequences of tape diagrams that explain the differences in terms of place value: 100 divided by 4, 10 divided by 4, and 1 divided by 4.
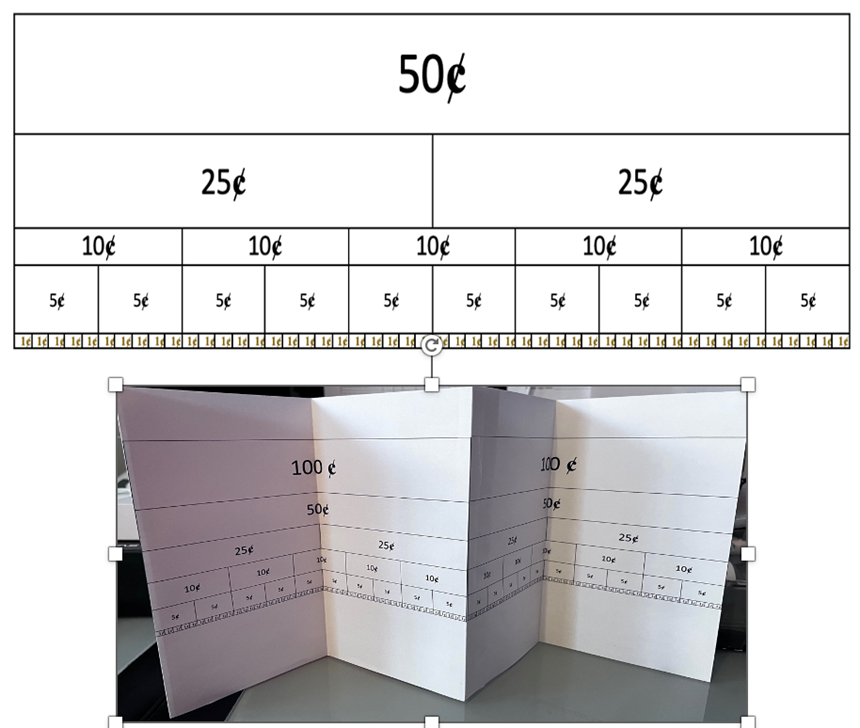
Figure 10. The above tape diagrams were used to make an accordion book.
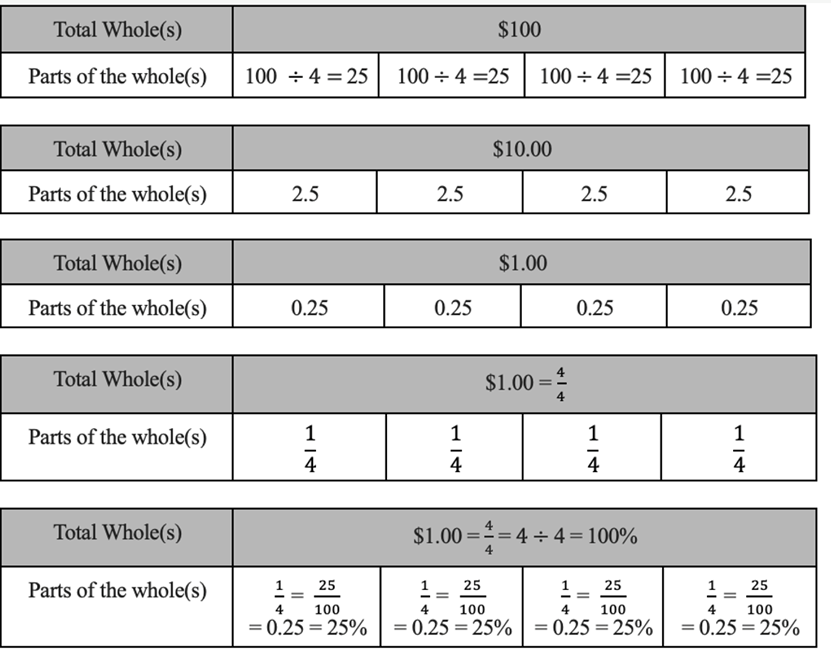
Figure 11. Different tape diagrams (above) showing how to divide $100, $10, and $1 by 4, or into fourths
Another model for a number line is a “meter stick” because it already has tick marks to indicate equal intervals; also, one side has units of measurement in centimeters and the other side has units of measurement in inches. As much as possible let students have time to define the starting and ending points of their number lines, as well as the equal distance of each interval (partition between two numbers).
Comments: