Environmental Injustice in Chicago's Southwest Side: Pollution, Past and Present

byNancy V. Ibarra

Introduction

As a little girl growing up in the Little Village neighborhood on the southwest side of Chicago, I could see “beautiful clouds” coming out of a smokestack from my backyard. They were dreamy and beautiful, and I thought I was lucky to have a cloud factory so near me. This smokestack belonged to one of the two remaining coal plants within the city limits of Chicago, the Crawford Plant. This plant was located less than two miles from my home in one of Chicago’s 26 industrial corridors. My sister, along with my mother, were diagnosed with asthma in those early years. My mother later died at the age of 47 from colon cancer. While I do not know the root causes of her illness, I have always wondered if the asthma and cancer were due to environmental factors. After extensive genetic testing, my sisters and I know that her cancer was not hereditary, and thankfully will not be passed on to us through our genes. This further led me to believe that her illness came from her environment.

This unit centers around the southwest side of Chicago, its past, its present, and the relationship that past formal systems have had on present-day environmental factors. After the Great Depression and during the New Deal, the practice of redlining began with the implementation of the National Housing Act of 1934.1 This practice by government officials restricted investment in areas deemed high-risk by banks. High-risk often meant that Black people and immigrants were living in these areas, and therefore, they were not a good place for bank lenders to invest in. They were considered “undesirable”, and the practice was explicitly discriminatory. My neighborhood, Little Village was labeled as “definitely declining” by the Home Owners’ Loan Corporation (HOLC). This was the government agency that was formed by the National Housing Act to help stabilize real estate that had depreciated, and in the process gave neighborhoods these ratings.2

The term redlining refers to the red color used to denote the most undesirable areas.3 According to the Washington Post, decades of federal housing discrimination did not only depress home values, lower job opportunities, and spur poverty in communities deemed undesirable because of race, it is the reason that 45 million Americans are breathing dirtier air today.4 Due to discriminatory practices, communities of color in the Unites States are systematically exposed to higher levels of air pollution.5

In this unit, our students will perform an in-depth study of the air pollution of two neighborhoods that were given negative ratings by the HOLC. The first neighborhood, Back of the Yards was considered “hazardous” and is where I teach, and my students live (Figure 1). As stated earlier, Little Village was considered “definitely declining” and it is where I have lived most of my life. Both neighborhoods are located on Chicago’s southwest side and are predominately Latinx. According to an article recently published in the Washington Post, compared to White Americans, Black and Latinx Americans live with more smog and particulate matter from nearby industry in areas that were redlined.6 This is important because particulate matter air pollution is connected to lung function, asthma attacks, and cardiovascular diseases, therefore putting people of color at greater health risks, ultimately impacting their quality of life. One recent study concluded that there is a significant positive association between particulate matter 2.5 exposure and the risk of lung cancer incidence and mortality.7

redlining map of chicago's back of the yards neighborhood

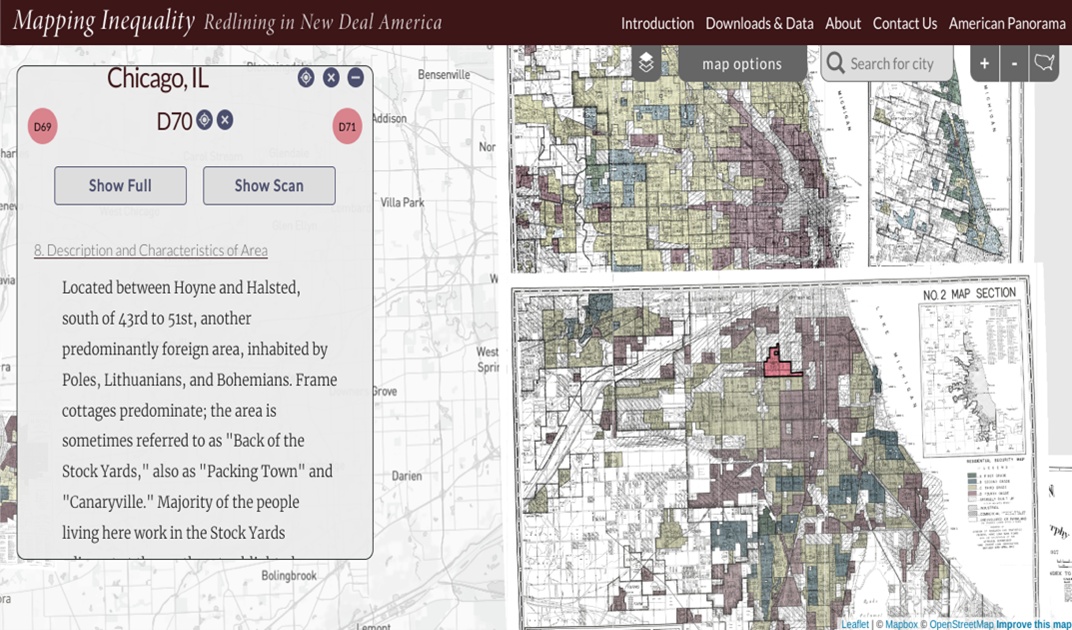
Figure 1: Redlining Map of Chicago’s Back of the Yards Neighborhood.8

Rationale

I chose to study the southwest side of Chicago because it is personal, not only for myself, but more importantly, for my students. Learning will be relevant to their everyday lives. I anticipate that my students will relate to the community’s concerns presented in the lessons. There is a wide disparity in the city of Chicago between the northside and the southside when it comes to race, socio-economic status, and available resources. Students will discover that this disparity is in part a result of racist formal practices, such as redlining, that have contributed to the environmental injustices that the city of Chicago faces today. Students will investigate how redlining has affected the environment in which they live. For children, as with adults, learning this information may take an emotional toll. It is important to look at constructive solutions to these problems to avoid a sense of hopelessness. For this reason, the unit will focus on examining successful grassroots efforts, especially by people of color advocating for their own neighborhoods.

We will look at the past by studying the history of the stockyards in Back of the Yards and how it took grassroots efforts to pass laws that would eventually make significant positive environmental changes. Then we will study particulate matter air pollution and the effects it has on our health. Finally, we will move on to the Little Village neighborhood which, again through grassroots efforts, has made great environmental justice strides in the last decade.

School Demographics

Seward Communication Arts Academy is a Pre-K through 8th-grade neighborhood school located in the Back of the Yards neighborhood. Back of the Yards is a vibrant community composed of mostly Mexican immigrant families. Our students are bright, inquisitive, and in the process of becoming active members of our global society. They have legitimate concerns about the world they live in and are constantly searching for ideas of how to make it better. Presently, we have 482 students. Ninety-seven percent of our students are Latinx, mostly of Mexican background. More recently, we have new students from Central and South America, diversifying our Latinx population. Ninety-eight percent of our students come from low-income households. Fifteen percent of our students have an Individualized Education Plan (IEP) and fifty-six percent are English language learners. Before Mexican immigrants came to this area of the city, Irish, German, Polish, Lithuanian, and other European immigrant workers lived here. Back of the Yards is historically an immigrant community and continues today. This unit will be written for about 60 8th-grade students, mostly children of immigrant parents. We are an International Baccalaureate school, which means our units are planned within a global context lens. Aside from this, there is a dire need for social justice centered education within the science curriculum since scientific innovation does not always treat members of our society fairly.

Content Objectives

There will be three main parts to this unit. The first part will introduce the history of the Stockyards in the Back of the Yards. I plan to read excerpts from The Jungle by Upton Sinclair who writes about the experience in the stockyards of a young Lithuanian immigrant during the early 1900s. We will look at the role Mary McDowell and other social reformers played, and the connection she makes to the environmental justice fights of today. We will also look at how despite the efforts, Back of the Yards was still considered a neighborhood that did not “have much of a future” by government officials and was redlined from the 1930s to 1968. This redlining contributed to making Back of the Yards a place where industry, along with air pollution, is ever present.

The second part will look at air pollution in the city of Chicago. Since this unit is for a science class, this is where most of the time will be spent. The prior knowledge that the students will need is familiarity with the periodic table of elements, atoms and molecules, and chemical and physical reactions. Once students are familiar with this prior knowledge, we will look at common air pollutants and the effects they have on our communities. I will use the EPA Environmental Justice and Screening Tool and the Climate and Economic Justice Screening Tool to investigate the concentration of pollutants within the city.9 We will also look at data using the Not Even Past: Social Vulnerability and the Legacy of Redlining site by the University of Richmond10 that demonstrates how pollution is unevenly distributed among the city and is many times positively correlated with areas that were redlined. During the lessons, students will investigate the correlation between race, social-economic status, and the amount of air pollution in a community.

Finally, the third part will look at the grassroots efforts of The Little Village Environmental Justice Organization (LVEJO) and its work to make positive environmental changes, most notably, the closing of the only two coal plants in the city of Chicago. Researching these neighborhoods provides a primary source for learning about environmental justice in our students’ own backyards. Learning Chicago’s history and making connections to the environmental justice movements of today is a powerful way to engage students in their learning.

Chicago

Chicago is a city of over 2.5 million people. Roughly one third of the population is Black, one third Latinx, and one third White. Asians make up about 7 percent of the population.11 Despite the apparent diversity that these numbers suggest, Chicago continues to be one of the most segregated cities in the country with most of its Black and Brown residents living in the south and west sides of the city.12 Chicago is home to 26 industrial corridors. Industrial corridors are areas that are designated for carrying out industrial development. With nearly 250 million square feet of industrial space, the City of Chicago's industrial inventory accounts for more than 20 percent of the total industrial inventory in the region.13 During the 1990s, Chicago saw them as important to the economy and designated them as Industrial Corridors to provide protection and incentives for industrial companies. There is a high concentration of these corridors on the southwest side. Both Back of the Yards and Little Village are sitting on or are adjacent to one of these corridors, therefore carrying a higher burden of air pollution for their residents. For both neighborhoods, ninety-five percent of the Illinois population experiences equal or less exposure to particulate matter 2.5, a harmful particulate matter caused in part by diesel pollution.14 Industrial corridors are mostly placed in areas with preexisting infrastructure such as ports, highways, and railroads.15

History of Environmental Justice

Environmental justice is defined as the fair treatment and meaningful involvement of all people regardless of race, color, national origin, or income with respect to the development, implementation, and enforcement of environmental laws, regulations, and policies.16 Long before the term environmental justice was coined, there were people doing the work. According to Bullard and Johnson,

The impetus of change came from people of color, grassroots activists, and their “bottom-up” leadership approach. Grassroots groups organized themselves, educated themselves, and empowered themselves to make fundamental change in the way environmental protection is administered in their community.17

In the summer of 1969, the Young Lords declared a “garbage offensive”.18 Lead by young radicals at the height of the civil rights movement, the Young Lords came out to the streets of New York and stopped traffic with piles of garbage to demand better sanitation and public health services for Puerto Ricans and Black neighborhoods in Harlem.19 The previous year, the nation had witnessed Martin Luther King’s support of the Memphis Sanitation Strike of 1968, which many of our students are familiar with. The purpose of the strike was to support the striking Black garbage workers’ demand for equal pay and better working conditions.20 These examples of missions for environmental justice were led by people of color, those who were mostly affected by the environmental injustices in their respective towns.

Years later, Benjamin Chavis, then executive director of the Commission for Racial Justice of the United Church of Christ defined environmental racism as,

Environmental racism is racial discrimination in environmental policy making, the enforcement of regulations and laws, the deliberate targeting of communities of color for toxic waste facilities, the official sanctioning of the life-threatening presence of poisons and pollutants in our communities, and the history of excluding people of color from leadership of the ecology movements.21

People such as Dollie Burwell were instrumental in the Warren County protests in North Carolina when the state dumped 120 million pounds of soil contaminated with polychlorinated biphenyls (PCBs) into a nearby landfill in the county with the highest proportion of African Americans.22 Dollie, along with other mostly Black women from the Coley Springs Missionary Baptist Church led the protests. These protesters put environmental racism on the map. Years later, the state of North Carolina spent over $25 million to clean and detoxify the Warren County PCB landfill.23 Today, hundreds of studies conclude that in general, ethnic minorities, indigenous persons, people of color, and low-income communities confront a higher burden of environmental exposure pollution.24 There have been an extensive number of studies conducted on the environmental risks experienced based on race and social economic class. The majority of studies found that race was a more important predictor than income of where environmental hazards are located. 25 In a separate study published in 1987 titled Toxic Wastes and Race in the United States, it was found that the average percentage of people of color containing at least one commercial hazardous waste facility was doubled that of areas containing none.26 In Rush to Judgement: An Empirical Analysis of Environmental Equity in U.S. Environmental Protection Agency Enforcement Actions, it was found that when it comes to cleaning up toxic waste sites, white communities see faster action than communities where Blacks, Latinx and other minorities live.27 A study that is closer to Chicago, just 27 miles from our school is of the U.S. Steel Corporation in Gary, Indiana28 which found that Latinx and African Americans faced disproportionally high levels of exposure to environmental toxins both on the job at the steel plant and in their neighborhoods. These studies suggest that many environmental justice issues are driven by environmental racism.

A recent study spanning a 50-year period in Michigan, found a pattern of locating hazardous waste in neighborhoods composed of working-class and people of color. What they found is that before 1970, there was very little evidence of disparities in facility siting’s. They did not see significant changes until the 1970s and 1980s. They attributed this to the rising public concerns about environmental hazards during this period. 29 After these rising concerns, the industry began to put LULUs, locally unwanted land uses, in areas with the path of less resistance. Because low-income people and people of color tend to have less political and economic power, they were placed in their neighborhoods. NIMBY, “not in my back yard” became PIBBY, place in Blacks’ backyards.

Particulate Matter Air Pollution

Particulate matter is a mixture of solid particles and liquid droplets that vary in size, composition, and origin.30 There is a known causative relationship between particulate matter air concentration and daily mortality rates. In a recent article published by The New York Times, it was reported that worldwide, 10 million people die from the effects of air pollution, and as many as 7 million of those deaths are linked to particulate matter produced.31 Fine particulate matter air pollution is a greater risk to health since only very small particles can be inhaled into the deepest part of the lungs. The U.S. national health standards base the quality of ambient air on the mass concentration of inhalable particles.32 Fine-particulate air pollution includes particles with an aerodynamic diameter equal to or below 2.5 micrometers.33 These fine particles are derived primarily from the combustion of fossil fuels in transportation, manufacturing, and power generation, hence the detrimental effects of living near an industrial corridor. These particles tend to be more toxic than inorganic particles, such as salt and dust, and can be breathed more deeply into the lungs than larger particles.34

In a longitudinal study of six U.S. cities (Watertown, Massachusetts; Harriman, Tennessee; St. Louis, Missouri; Steubenville, Ohio; Portage, Wisconsin; and Topeka, Kansas), it was found that fine-particulate air pollution contributed to excess mortality in certain U.S. cities.35 The data was stark. The study followed 8,111 adults for 14 to 16 years. External factors such as smoking and BMI were controlled. It was found that residents of Topeka had a greater chance of survival than residents of Steubenville, while Steubenville continuously had the highest concentration of particles throughout the city compared to the other cities. Mortality was strongly associated with levels of fine, inhalable, and sulfate-containing particles. Elevated levels of particulate air pollution have been associated with declines in lung function or with increases in respiratory symptoms.36

Although air quality has improved in the United States, people of color continue to be disproportionately affected by pollution. Years after redlining was considered illegal, the aftermath is still showing. A recent study published in Environmental Science and Technology Letters, explores how redlining relates to present day air pollution disparities of 202 cities. This study is the first full-scale examination of air pollution disparities relative to historical redlining.37 Their findings show that informal systems continue to shape systemic environmental exposure disparities in the United States, years after the practice of redlining was considered illegal. They found a high degree of city-to-city consistency in intra-urban disparities. NO2 levels from combustion were higher in “D” neighborhoods than overall (i.e., considering all HOLC mapped areas) in 80% of the 202 cities and were lower in “A “neighborhoods than overall in 84% of cities.38

Redlining

While it is abundantly clear that redlining affected Black communities the most, immigrant communities were also affected. The following text describes how the HOLC, Home Owners’ Loan Corporation, described the Back of the Yards neighborhood in 1940:

Located between Hoyne and Halsted, south of 43rd to 51st, another predominantly foreign area, inhabited by Poles, Lithuanians, and Bohemians. Frame cottages predominate; the area is sometimes referred to as "Back of the Stock Yards," also as "Packing Town" and "Canaryville." Majority of the people living here work in the Stock Yards adjacent at the northeast; a blighted, tough area. Stock Yard odors do not appear to be detrimental to the class of inhabitant. Good schools, churches and play yards are in evidence. The area will remain as it is for many years; at least, as long as the Stock Yards are located between Pershing Road (39th St.) and 47th, between Ashland and Halsted, and remain in this location. Transportation by business streets; such as, Ashland Ave., 37th St., Racine, and 51st St. Transportation is fair. The area has no future, except as a convenient place as residence for those engaged in the Stock Yard and packing plants. Between Halsted and Racine, and 47th south to 49th, are some shacks and old frame residences, interspersed with manufacturing plants. West of Laflin Pl., between 46th and 47th, are a few old residences mixed with retail business. The area is uniformly poor and one of the first areas where Poles located about 40 years age.

Notice that the description states the area has no future. Because of this description, the area was given a D grade, and therefore redlined. These letter grades were a classification system created by agents of the Federal Government who worked for the HOLC. Neighborhoods receiving the highest grade of "A" were considered minimal risks for banks and other mortgage lenders and were shaded in green on maps. They were safe investments. Those receiving a “B” were “still desirable”. On the other hand, those receiving a “C” were “definitely declining”, and the lowest grade of "D," shaded in red, were considered "hazardous."39 This practice continued until 1968, when the Fair Housing Act banned racial discrimination in housing. Although the Civil Rights Movement helped dismantle these racist and discriminatory formal systems, informal systems have remained. Industrial companies responded to redlining by putting industry in these redlined areas since there was little resistance from the community.

Back of the Yards/The Union Stockyards

"The line of the buildings stood clear-cut and black against the sky; here and there out of the mass rose the great chimneys, with the river of smoke streaming away to the end of the world."40

This quote comes from Upton Sinclair’s book, The Jungle and it describes the first impressions Jurgis, a Lithuanian immigrant has of the stockyards. Seward school is less than a mile away from what used to be the Unions Stock Yards. The Union Stock Yards, along with other packing plants, and until the 1950s, was the largest meat packing center in the United States.41 The gathering of these centers was due to the railroads and the perfection of the refrigerated boxcar by 1880. In fact, it was the union of nine railroads that purchased 320 acres to store livestock prior to butchering and processing them. At the start of the 20th century, the Stock Yards and surrounding meat packing centers provided 82 percent of domestic meat consumed in the United States.42 This meatpacking industry attracted immigrants from Poland, Lithuania, Slovenia and other mostly Eastern and Southern European countries. As one may conclude, the meat packing industry produced environmental hazards for its workers and nearby community residents.

Mary McDowell was a prominent social reformer who is considered by some to be the godmother of environmental justice. She was nicknamed “The Garbage Lady”43 and advocated for safe working conditions for the workers of the Union Stockyards. In the late 1800s, she helped build Davis Square Park. This was around the same time that Seward school was built. In 1894 she established the University of Chicago Settlement House in the Back of the Yards neighborhood. Immigrant workers of the stockyards depended on this as a community resource. The house served the stockyard workers as they experienced poverty, pollution, and illnesses due to the unsanitary working conditions.44 Mary McDowell’s legacy still lives on. Our students play at Davis Square Park, Seward's volleyball and soccer teams practice there, and neighborhood kids attend after-school clubs there.

Bubbly Creek, which is two miles from our school, was the nickname given to the South Fork of the South Branch of the Chicago River. Waste from the stockyards was dumped into this part of the river, causing the water to lose oxygen, and allowing bacteria to form methane gas which resulted in bubbles rising within the river. Methane is formed during the decomposition of organic materials.

“Slaughterhouses within the Union Stock Yards dumped tremendous amounts of animal waste, blood, and offal into the creek, using it as an open sewer. So much refuse was poured into the river that hydrogen sulfide and methane, the results of decomposing carrion, began to bubble to the surface.” 45

The plight of the stockyard workers became well known with The Jungle. In 1904, Upton Sinclair was a journalist for the socialist magazine, Appeal to Reason and was sent to Chicago to cover a labor strike in the stockyards. He spent a year in Chicago writing about the exploitation against the stockyard workers. This piece later became his bestselling book, The Jungle. In The Jungle, Upton Sinclair writes about how the surface of the Chicago River would catch fire. 46 The book vividly described the working conditions and meat packing practices and prompted an investigation. The results of the investigation urged the Roosevelt administration to pass the Meat Inspection Act of 1906, ensuring that livestock were slaughtered and processed under sanitary conditions, and the Pure Food and Drug Act, which prohibited the sale of misbranded or adulterated food and drugs in interstate commerce.47

Mary McDowell’s efforts convinced the city to fill in a portion of Bubbly Creek and to also close garbage dumps around the neighborhood.  She knew that low-income immigrant communities were targets of environmental pollution and its associated human health risks. In many ways, more than 100 years later, grassroots environmental groups are addressing similar issues in Chicago today.

Little Village

Little Village was home to one of two of the nation’s oldest and dirtiest coal-fired power plants. The Crawford plant with the Fisk plant next door in the community of Pilsen. Both plants were owned by Midwest Generation and were the last two coal plants operating within Chicago city limits.48 Little Village is a small but densely populated neighborhood of some 70,000 residents, mostly Latinx families and children.49 Following the great Chicago Fire of 1871, Little Village had an influx of German, Czech, and Polish immigrants who came to work at the nearby factories.50 It is located within one of Chicago’s industrial corridors. Little Village is often referred to as the Mexico of the Midwest and is the second highest grossing shopping district in the city. A cruise down 26 street will have you passing blocks filled with boutiques full of quinceañera glory, shops with cowboy attire, sometimes as many as six stores in one city block, and restaurants galore. There are outdoor vendors selling Mexican corn on the cob, tamales and champurrado throughout the year, even in the coldest temperatures. There is much pride in heritage as displayed during the Mexican Independence Day parade, the biggest in the city. It is a beautiful community that needs to be protected.

The Little Village Environmental Justice Organization, LVEJO, is doing just that. LVEJO began organizing in 1994 when a group of public-school parents became concerned over potential exposure of their children to dangerous particles during school renovations. The school, Gary Elementary, has similar demographics as Seward Academy; 809 students, 98.6% Latinx and 93.1% low income.51 Their complaints worked and urged the school administration to change renovation plans. Shortly after, the same parents began to turn their attention to other environmental issues in the neighborhood.

LVEJO soon developed a campaign to remediate the Celotex Superfund site about a mile and a half from the school. The Celotex site was used for making, storing, and selling asphalt roofing products. This contaminated soil with coal tar. In 1989, Little Village residents began complaining about coal tar present on their property.  After the discovery of the contamination, the U.S. EPA found that it warranted cleanup under the superfund program. The EPA worked on cleaning the area. After the clean-up and the acquiring of the site by another corporation, the Chicago Park District and the City of Chicago worked closely with LVEJO, the EPA and the IEPA (Illinois Environmental Protection Agency) on plans for a 22-acre park. The park was opened in December of 2014 and is named La Villita Park.52

In 2005 LVEJO’s community organizer Kim Wasserman-Nieto became the Executive Director. Wasserman and LVEJO’s organizers waged tireless grassroots campaigns to close the Crawford and Fisk coal power plants. Along with PERRO, another environmental justice group, they formed the Clean Power Coalition. In 2012, they were successful in retiring the Crawford and Fisk plants.53 Residents were suffering high rates of asthma, bronchitis, and a slew of other respiratory illnesses. When coal is burned it releases a number of airborne toxins and pollutants. They include mercury, lead, sulfur dioxide, nitrogen oxides, particulate matter, and various other heavy metals. The extremely harmful particulate matter 2.5 that was described earlier is included in these pollutants. Health impacts can range from asthma and breathing difficulties, to brain damage, heart problems, cancer, neurological disorders, and premature death.54 The closing of the Crawford Plant was a tremendous community victory, and it was led by residents of Little Village who were concerned about the right for their children to breathe clean air. For her leadership and commitment to this fight, Kim Wasserman-Nieto was awarded the prestigious Goldman Environmental Prize in April of 2013.55

While much has been accomplished by people such as the concerned parents of a neighborhood school, or a socialist journalist reporting on the unsanitary work environment of its workers, there is still a lot left to do. It is important to create awareness through science lessons our students can relate to and understand. I am hoping to instill a sense of ownership and empowerment in them as they take this new knowledge and use it to advocate for environmental solutions for their own communities.

Teaching Strategies and Classroom Activities:

Background Information

In Environmental Justice in a Moment of Danger, Sze states that “music, websites, films, and graphic novels compose a counterhegemonic soundtrack for a restorative environmental justice politics grounded in solidarity.”56 I plan to use a wide range of genres in my lessons. We will begin by becoming familiar with the periodic table of elements and their properties. In one of the lessons, the students will take an element and create a character using the physical and chemical characteristics of the element. For example, if a student has the element helium, their character will be extremely light and flowing in air. After students learn that different elements behave differently, they will be introduced to atoms and molecules, what makes atoms reactive and nonreactive, how and why molecules bond, and understand the fundamental science principal that matter cannot be created nor destroyed. They will engage in various hands on activities and science experiments in order to further understand the content. Once students have this information, they will have a better understanding of matter found in the atmosphere. We will look more in depth at common air pollutants such as particulate matter 2.5, nitrogen dioxide (NO2), sulfur dioxide (SO2), and ozone (O3).

Activity 1-Redlining Tool

Students will look at the redlining tool, Not Even Past: Social Vulnerability and the Legacy of Redlining. This site juxtaposes the HOLC maps from the 1930s with contemporary health disparities (Figure 2). They will look at Back of the Yards, Little Village, and other neighborhoods and notice the similarities between redlining eighty years ago and health disparities today.57 After comparing the data between the HOLC maps and the contemporary maps, they will be able to discuss their findings with the class and their families.

example of the not even past: social vulnerability and legacy tool for Chicago, IL

Figure 2: Example of the Not Even Past: Social Vulnerability and Legacy tool for Chicago, IL. 58

Activity 2 -EPA Environmental Justice Screening Tool or Climate and Economic Justice Screening Tool

Students will use these tools to record data for Back of the Yards, Little Village and two other Chicago neighborhoods of their choice. I have begun to fill particulate matter 2.5 as an example. They will look for trends between air pollution and health concerns such as asthma and low life expectancy. After recording their data, they will be able to discuss their findings with the class.

Climate and Economic Justice Screening Tool Student Data Sheet:

Back of the Yards

Little Village

Neighborhood of your choice

Neighborhood of your choice

Particulate Matter 2.5 in the air -Level of inhalable particles, 2.5 micrometers or smaller

89th percentile

90th percentile

Diesel particulate matter exposure -Amount of diesel exhaust in the air

Proximity to hazardous waste facilities -Count of hazardous waste facilities within 5 kilometers

Low Life Expectancy

Asthma

Lack of Green Space

Activity 3-Plotting the Six City Study

After a Google Slides presentation of the Six Cities Air Pollution Study, Students will receive Table 1from the six cities study entitled “Characteristics of the Study Population and Mean Air-Pollution Levels in Six Cities” . They will plot the points for the fine particles, nitrogen dioxide particles, and sulfate particles. They will also plot the deaths per 1000 persons or life expectancies in the six cities. After plotting their points and analyzing the graphs, they will be able to discuss their findings with the class.

Activity 4 -Plotting Classroom Air Quality

For 5 weeks, students will take daily air quality data using an air quality detector. The Air Quality Monitor LFF measures particulate matter (PM 2.5), time, temperature, and humidity. They will control for time and use their data to graph the results. After the 5 weeks, students will make interpretations of their data and discuss their findings with the school community.

Appendix on Implementing District Standards

Next Generation Science Standards:

MS-ESS3-3 Earth and Human Activity

Apply scientific principles to design a method for monitoring and minimizing a human impact on the environment.

-Examples of the design process include examining human environmental impacts, assessing the kinds of solutions that are feasible, and designing and evaluating solutions that could reduce that impact.

MS-ESS3-5 Ask questions to clarify evidence of the factors that have caused the rise in global temperatures over the past century.

-Examples of factors include human activities (such as fossil fuel combustion, cement production, and agricultural activity) and natural processes (such as changes in incoming solar radiation or volcanic activity). Examples of evidence can include tables, graphs, and maps of global and regional temperatures, atmospheric levels of gases such as carbon dioxide and methane, and the rates of human activities. Emphasis is on the major role that human activities play in causing the rise in global temperatures.

Common Core English Language Arts Standards (CCSS.ELA)

Reading: Science & Technical Subjects (6-12)

CCSS.ELA-LITERACY.RST.11-12.1 Cite specific textual evidence to support analysis of science and technical texts, attending to important distinctions the author makes and to any gaps or inconsistencies in the account.

CCSS.ELA-LITERACY.RST.11-12.7 Integrate and evaluate multiple sources of information presented in diverse formats and media (e.g., quantitative data, video, multimedia) in order to address a question or solve a problem.

Bibliography

Atlas, Mark. 2001. "Rush to Judgement: An Empirical Analysis of Environmenal Equity in U.S. Environmental Protection Agency Enforcement Actions." Law & Society Review Vol. 35 No. 3 633-682.

Campa, Aydali. 2023. Inside Climate News . April 17. Accessed July 15, 2023. https://insideclimatenews.org/news/17042023/chicagos-little-village-residents-fight-for-better-city-oversight-of-industrial-corridors/.

Diane Pathieu, Rob Elgas. 2020. ABC 7 Eyewitness News. April 14. Accessed July 15, 2023. https://abc7chicago.com/implosion-crawford-coal-plant-little-village-news/6099365/.

Douglas W. Dockery, C. Arden Pope III, Xiping Xu, John D. Spengler, James H. Ware, Martha E. Fay, Benjamin G. Ferris, Frank E. Speizer. 1993. "An Association Between Air Pollution and Mortality in Six U.S. Ciities." The New England Journal of Medicine 1753-1759.

2023. EPA's Environmental Justice Screening and Mapping Tool. August 1. Accessed July 15, 2023. https://ejscreen.epa.gov/mapper/.

Fears, Darryl. 2022. The Washington Post. March 9. Accessed July 15, 2023. https://www.washingtonpost.com/climate-environment/2022/03/09/redlining-pollution-environmental-justice/.

Haley M. Lane, Rachel Morello-Frosch, Julian D. Marshall, and Joshua S. Apte. 2022. "Historical Redlining Is Associated with Present-Day Air Pollution Disparities in U.S. Cities." Environmental Science & Technology Letters 345-350.

Hurley, Andrew. 1993. Environmental Inequalities: Class, Race, And Industrial Pollution in Gary Indiana 1945-1980. Chapel Hill: University of North Carolina Press.

2023. Illinois Report Card. August 4. Accessed July 15, 2023. https://www.illinoisreportcard.com/school.aspx?source=studentcharacteristics&source2=enrollment&Schoolid=150162990252215.

2023. Infoplease. July 15. Accessed July 15, 2023. https://www.infoplease.com/encyclopedia/history/north-america/us/home-owners-loan-corporation#:~:text=Home%20Owners'%20Loan%20Corporation%20(HOLC,facing%20loss%20of%20their%20property.

Ludwig, Mike. 2023. truthout.org. 4 22. Accessed 7 15, 2023. https://truthout.org/articles/the-civil-rights-movement-fought-for-environmental-justice-long-before-earth-day/.

2023. LVEJO. August 1. Accessed July 15, 2023. http://www.lvejo.org/.

2023. Mapping Inequality Redlining in New Deal America. July 15. Accessed July 15, 2023. https://dsl.richmond.edu/panorama/redlining/#loc=5/39.1/-94.58.

McVean, Ada. 2021. McGill Office for Science and Society. February 24. Accessed July 15, 2023. https://www.mcgill.ca/oss/article/health-history/environmental-disaster-brought-you-meat-chicagos-bubbly-creek.

Ning Wang, Kerrie Mengersen, Shilu Tong, Michael Kimlin, Maigeng Zhou, Lijun Wang, Peng Yin, Zhiwei Xu, Jian Cheng, Yuzhou Zhang, Wenbiao Hu. 2019. "Short-term association between ambient air pollution and lung cancer mortality." Environmental Research 585-596.

2023. Not Even Past: Social Vulnerabity and the Legacy of Redlining. August 4. Accessed July 15, 2023. https://dsl.richmond.edu/panorama/redlining/#loc=5/39.1/-94.58.

Paul Mohai, David Pellow, J. Timmons Roberts. 2009. "Environmental Justice." The Annual Review of Environment and Resources 405-430.

Robert D. Bullard, Glenn S. Johnson. 2000. "Environmental Justice: Grassroots Activism and Its Impact on Public Policy Decison Making." Journal of Social Issues 555-578.

Rouse, Kristen L. 2023. Britannica. June 23. Accessed July 15, 2023. https://www.britannica.com/topic/Meat-Inspection-Act.

Sinclair, Upton. 1906. The Jungle. Garden City, New York: Dover Publications.

Sze, Julie. 2020. Environmental Justice in a Moment of Danger. University of California Press.

2023. The University of Chicago. July 15. Accessed July 15, 2023. https://chicagostudies.uchicago.edu/back-yards/back-yards-history-back-yards.

2019. Union of Concerned Scientists. July 2019. Accessed July 15, 2023. https://www.ucsusa.org/resources/coal-power-impacts#:~:text=Coal%20impacts%3A%20air%20pollution&text=They%20include%20mercury%2C%20lead%2C%20sulfur,neurological%20disorders%2C%20and%20premature%20death.

2023. United States Census Bureau. July 15. Accessed July 15, 2023. https://www.census.gov/.

Wallace-Wells, David. 2022. The New York Times. July 8. Accessed July 15, 2023. https://www.nytimes.com/2022/07/08/opinion/environment/air-pollution-deaths-climate-change.html.

2023. WTTW. July 15. Accessed July 15, 2023. https://interactive.wttw.com/chicago-stories/union-stockyards/mary-mcdowell-and-the-fight-for-environmental-justice-for-the-back-of-the-yards.

2023. WTTW. July 15. Accessed July 15, 2023. https://interactive.wttw.com/chicago-by-l/neighborhoods/little-village.

Notes

1 Haley M. Lane 2022

2 Infoplease 2023

3 Mapping Inequality Redlining in New Deal America 2023

4 Fears 2022

5 Haley M. Lane 2022

6 Fears 2022

7 Ning Wang 2019

8 Mapping Inequality Redlining in New Deal America 2023

9 EPA’s Environmental Justice Screening and Mapping Tool 2023

10 Not Even Past: Social Vulnerability and the Legacy of Redlining 2023

11 United States Census Bureau 2023

12 Not Even Past: Social Vulnerability and the Legacy of Redlining 2023

13 Campa 2023

14 EPA’s Environmental Justice Screening and Mapping Tool 2023

15 Campa 2023

16 Robert D. Bullard 2000

17 Ibid

18 Ludwig 2023

19 Ibid

20 Robert D. Bullard 2000

21 Paul Mohai 2009

22 Ibid

23 Robert D. Bullard 2000

24 Paul Mohai 2009

25 Ibid

26 Ibid

27 Atlas 2001

28 Hurley 1993

29 Paul Mohai 2009

30 Douglas W. Dockery 1993

31 Wallace-Wells 2022

32 Ibid

33 Douglas W. Dockery 1993

34 Ibid

35 Douglas W. Dockery 1993

36 Ibid

37 Haley M. Lane 2022

38 Ibid

39 Ibid

40 Sinclair 1906

41 The University of Chicago 2023

42 McVean 2021

43 WTTW 2023

44 Ibid

45McVean 2021

46 Sinclair 1906

47 Rouse 2023

48 Union of Concerned Scientists 2019

49  The University of Chicago 2023

50 WTTW 2023

51 Illinois Report Card 2023

52 LVEJO 2023

53 Ibid

54  Union of Concerned Scientists 2019

55 LVEJO 2023

56 Sze 2020

57 Mapping Inequality Redlining in New Deal America 2023

58 Ibid


Comments (0)

Be the first person to comment

When you are finished viewing curriculum units on this Web site, please take a few minutes to provide feedback and help us understand how these units, which were created by public school teachers, are useful to others.
THANK YOU — your feedback is very important to us! Give Feedback