Topic 2 – Edwin Hubble and the expanding Universe (to be used after the principles of multiple regression have been studied).
Most of us associate Hubble with the telescope, which has given us many marvelous discoveries and pictures of the Universe. The telescope, launched in 1990, is 600 kilometers above the earth's surface. It is a fitting tribute to a great scientist, Edward Hubble, who spent his live studying distant galaxies. One of his major observations was that galaxies are in three basic formations. Spiral Galaxies are a flat disk with spiral arms; Elliptical Galaxies are egg shaped; and the final grouping, Irregular Galaxies which are linear or triangular. A collection of his pictures showing these groupings was published posthumously by one of his associates. His more famous discovery is that galaxies are moving away from each other. This measurement of the movement of galaxies away from each other, known as the Hubble Law, will be the second and final topic of this module.
The planet Earth is in a solar system that is part of the Milky Way galaxy. There are other planets, moons, comets, asteroids, etc. in other solar systems, which are in other galaxies. And, to paraphrase Carl Sagan, there are billions and billions of them. By using techniques such as parallax, light, and ray analysis, Hubble was able to determine distances and velocities of various galaxies.
Hubble found that there is a direct relationship between the residual velocity (the speed at which galaxies are moving away from each other) and the distance from each other. This can be plotted on a XY diagram, with Y= velocity. Based on his calculations, the Universe is expanding. This expansion is often compared to raisin bread rising. As the bread rises, the raisins move further apart from each other. Galaxies (the raisins) are constantly moving away from each other (the rising bread). Another way to illustrate this phenomenon is to blow up a balloon a little bit and put some dots on in to form a square. Now blow up the balloon even further and this is an illustration of our expanding Universe.
On January 17, 1929, Hubble presented his paper, "A relation between distance and radial velocity among extra-galactic nebulae". A portion of his data is listed in the table below. In calculating r, the correlation between the variables of distance and velocity, we find a fairly robust measure of association, .79. We can also set this up as multiple regression problem since we know that this is a linear relationship. (The charts below show the results of such an analysis. The regression calculation results in the following value for a straight line y= 454x –; 40, where x = distance.)

Calculating r is done in the same way that it was done for the Titus-Bode problem. If you use both the TI-83 and Excel, you see that the calculations are off a bit but this is due to the programming of algorithms; also, the hardware of each computer is always a little different; this difference is both machine and copyright induced.
Here we see that Hubble had a very good, but not excellent r. However, the r does show an irrefutable relationship. If we graph the x,y coordinates in Excel and draw a trend line (or regression line), the following chart results.
Again we see that there is a fair amount of variation of the actual observations versus the trend line, but there is definitely a linear pattern.
Hubble established the validity of his thoughts through the scientific method. As always happens, a host of other scientists retested his conclusions. However, there are skeptics, because proving a given theory on such a grand or galactic scale is always very difficult and unknown errors can creep in since we can never have perfect information and cannot conduct a controlled experiment, especially if it concerns the Universe. We have to work with what is out there with all its variables. In addition, other scientists may have a different opinion and wish to promulgate their theory over another's.
Another factor is improved science. By today's standards, the equipment available to Hubble in the 1920's is less accurate or sensitive. We now have coordinated telescopes around the world so that the combined observations result in a theoretical lens the diameter of the earth. There are all manner of radio telescopes. Since 1990, we have the Hubble telescope orbiting Earth. Obviously, then, our measurements since the 1920's are far superior.
Below is a second set of data (and the calculation of r) published by Kelsey and provided by an astronomer by the name of Abell, in the 1950's.

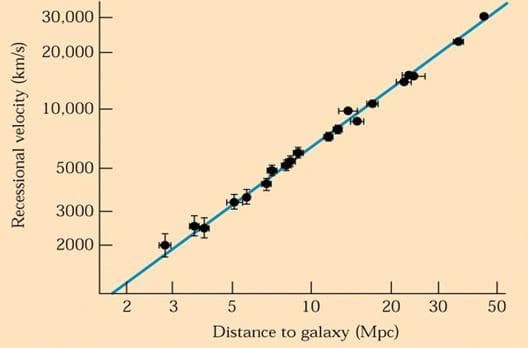
Using the same relation as postulated by Hubble, but with more accurate data, he achieves an r of .97, a much stronger relationship than Hubble found. Also, when we examine the results of the regression analysis, we see that the slope (the rise over the run) of the line is much less (72 compared with 454), resulting in a flatter line. Note that the data is much closer together, showing that the Hubble Law is re-verified. With the Hubble data, the slope of the line had a value of 454 (the value of Y when distance equals 0), with negative values. In the Abell data, all of our numbers are positive. This number, called the regression coefficient, gives us a much more realistic H 0 (72 rather than 454).
NASA continues these studies and its most current cart is reproduced below. (I was unable to find the input data for several reasons. Astronomical data are collected through very complicated measurements of light and rays. These are converted to data and graphed by the scientists and are typically not published in papers. Although we do not have the value of r, we can see that we have almost a perfect relationship as almost all of the data points are on the line.
For our final discussion, we can extrapolate another useful piece analysis from the Hubble Law. Not only is the Hubble Law a great piece of scientific discovery explaining our ever-expanding Universe, but also gives us data, which we can use to determine the age of the Universe.
The age of the Earth and other bodies in the Universe are determined in a variety of different ways, with the Hubble Law serving as a cross check. Using the "Big Bang" theory of the creation of the Universe, we assume that the "Big Bang" starts from a reference point equal to zero. Using Hubble's Law, we can calculate the time of the "Big Bang" and thereby the age of the Universe.
In order to utilize Hubble's Law (or the value of H o), we must start out with one of the most basic equations in Astronomy. This is the formula for Velocity:
V = H od
Where
- V = velocity of expansion
- H o = Hubble's constant
- d = distance
In order to find the age of the Universe we must solve for T (time) which will require a little bit of algebra. If we divide both sides of the equation by H o and we get d = V/H o . The standard distance formula is d = TR or distance equals time (T) multiplied by rate (R) of speed. Velocity however is directed speed. Substituting Velocity (V) for Rate of Speed (R), we get d = TV. By substituting for times x velocity for distance, we get TV = V/H o. Multiplying both sides of the equation by 1/V, we get the following:
 .
.
Thus, time is the reciprocal of the Hubble Constant H 0. In order to calculate T, we have to remember that H 0 is in Mega Parsecs or M/pc. A parsec is the distance light travels in 3.26 years in km or 3.09 x 10 1 3 km. Converting kiloparsec to megaparsec yields 3.09x 10 1 9 megaparsecs. One calendar year equals 3.156 x 10 7seconds. The age of the Universe is calculated as follows:

using the original H 0 of 454 we get T = 2,156,580,292; using the current H 0 of 72, we get T = 13,591,436,840 or approximately 14 billion years.
Try recalculating the above values using a calculator having parentheses and then use other values of H 0, which are available on a variety of internet sites. The values I've seen are all in the 70's and the goal is to get within 10% accuracy (but that's a topic for another session).
Have fun!!!
Comments: