Farming Activity
Lesson 1
I will begin by providing students with one 1” square tile and ask several questions such as, “What is the area of this figure?” “What is the perimeter?” Through careful modeling I will demonstrate on the whiteboard and record the answer. Next, students will be provided with two 1” square titles and asked to put them together make a domino. I will ask them the same questions. I will then ask students to rearrange the tiles and form as many figures as they can using only these two tiles and keeping in mind the rules as mentioned above. Students will continue these steps with trominoes, tetrominoes, pentominoes and hexominoes. Beginning with tetrominoes students will notice that you can have a polyomino with the same area but different perimeters. (See Figure G)
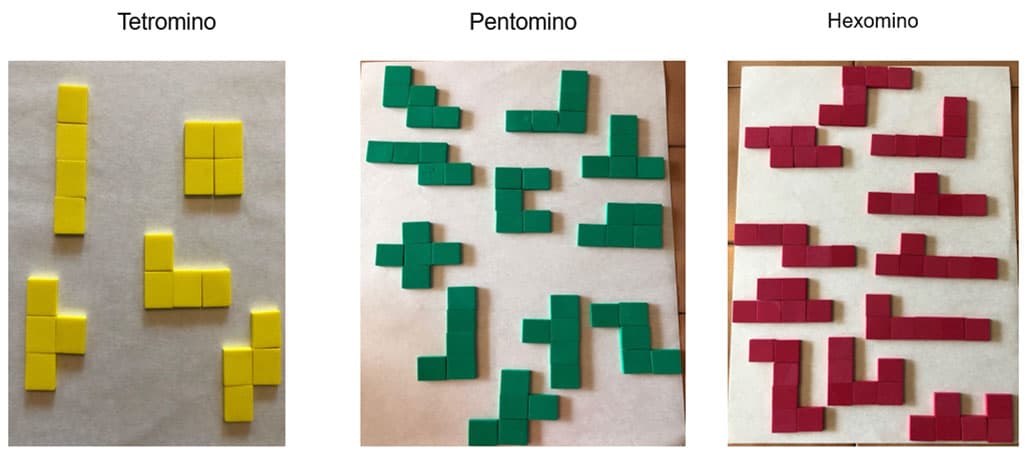
Figure G
Various tetrominoes, pentominoes, and hexominoes.
Students will work in table groups and will document their findings of tetrominoes, pentominoes and hexominoes on graph chart paper and on the Student Response Sheet (see below) before sharing out to the class.
Student Response Sheet
|
Draw Figure (Polyonimo) |
Perimeter |
Area |
|
1. |
||
|
2. |
||
|
3. |
||
|
4. |
||
|
5. |
Lesson 2
In lesson 2 students will take a closer look at squares and rectangles. I will begin by asking them to build three figures that are only rectangles or squares, each of which have an area of 16 sq. inches. (There will only be three ways: 1 x 16, 2 x 8, 4 x 4). (See Figure H)
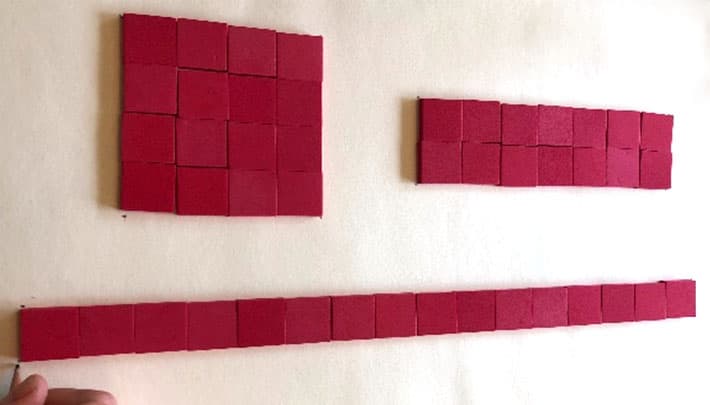
Figure H
Area of 16 sq. units in three ways: 1 x 16, 2 x 8, 4 x 4.
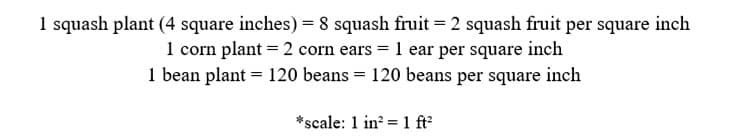
Next students will mark each of the corners, or vertices, of the figures they’ve created. They will then remove the 1-inch tiles, and they will connect the dots to mark the boundaries of their figure. This will represent their planting field. Throughout all our exercises we will use the scale of 1 in.:1 ft. to indicate the approximate relative sizes of our figural representation compared to its real-world counterpart. I chose this scale, as well as approximate crop yields, to represent values that were close to real life but would still be easy for my students to manipulate. (So they can grasp the concepts of area and perimeter without getting bogged down in overly complicated calculations.)
Students will be able to plant three different crops: beans, corn, and squash. Each of these crops will require a different amount of planting area. Beans will require one square inch. Corn will require two square inches. Squash will require four square inches. (This will have to be arranged in a 2 x 2 square, not a rectangle.) See Figure I.
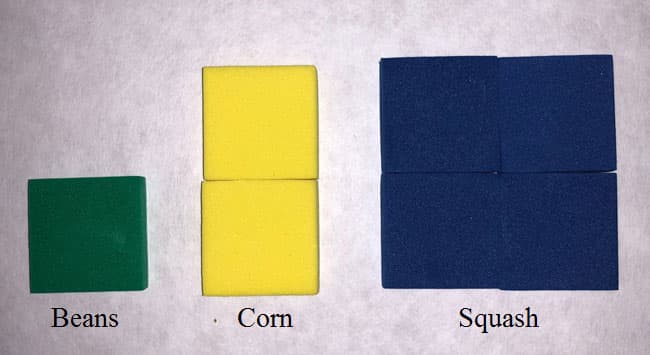
Figure I
Square inch tiles representing the amount of area for each crop.
Students will plant their field however they will be asked to keep in mind the rule of polyominos, that the regions for different plants that touch each other must share at least one complete edge of a square.

Figure J
Students planting their field according to the rules of polyominos.
The next step will be for students to calculate the area each crop takes up in their planting field. Lastly, using an approximate (the scale of 1 in.:1 ft. to indicate the approximate relative sizes) crop yield per square inch students will calculate how much of each crop they grew.
Students will be provided with 1” x 1” graph paper (individual) or poster size graphic paper (groups of 3 or 4) to draw their three planting fields. Last, students will be asked to share their planting fields using math vocabulary terms: covering, area, square inch, gap, amount.
Lesson 3
Students will be given a scenario of having to plant a field that will grow enough crops to feed one person through the winter months (three months). Prior to the start of this math lesson, the class will have a discussion to gather information about how much a person eats.
My students will start with the given that a person can live on two ears of corn, two squash, and forty beans a day. They will calculate that for one person to survive for a ninety-day winter they will need 180 ears of corn, 180 squash, and 3600 beans. Having calculated this and knowing that one corn plant produces two ears of corn and needs 2 ft² to grow, student can figure out that they will need 180 ft² of space to plant corn. Similarly, knowing one squash plant produces eight squash and needs 4 ft² to grow, they will need 92 ft² of space to plant twenty-three squash plants, and they will need 30 ft² of space for bean plants in order to produce 3600 beans.

The next step in the activity is to have students use a piece of 11 in x 8 ½ inch graph paper to plant a “graphical” farm which would feed one person throughout the winter months. Because a scale of 1 square inch to 1 square foot would not be practical for this lesson each square in the graph paper will represent 1 square foot (I calculated that each piece of graph paper should have 1,452 squares, more than enough space to accomplish this task). My final exercise will be to plant a field to feed a family of 4. I will again use graph paper and have students find out how many square feet of planting space will be required to produce enough crop yield for their objective. Using all that they have learned about polyominos and calculating area as a function of length x width, my students can use their imagination to create a wide variety of different crop arrangements to still produce the required crop yield.
At the end of this project students will share their unique strategies and field designs with one another using topic appropriate vocabulary to describe their rational for arranging crops in the way they chose.
Comments: