Unit Content
Brief History of Spectroscopy
Spectroscopy is by far the single most powerful tool for astronomers to characterize stars, planets, asteroids, comets, galaxies, and other celestial objects of great distances away.By analyzing the spectra of stars, scientists can determine their chemical composition, relative motion, luminosity, mass, temperature, density, and color. The lessons developed for this curriculum unit will introduce the students to this groundbreaking technique and its applications. They will recognize the “colors of the rainbow” in these activities. But first, let us identify some significant scientific contributions to the field of spectroscopy.
In 1672, Sir Isaac Newton described his rainbow experiment in his first paper submitted to the Royal Society. Newton passed a beam of sunlight through a prism. This white light characteristic of sunlight emerged from the prism in the colors of the rainbow. The rainbow forms because as white light enters the prism, the medium changes from air to solid and the light bends and undergoes refraction. Not all the colors are bent by the same amount and separate by wavelengths, each wavelength corresponds to a given color in the visible light range. Newton then passes the rainbow of colors through a second prism. Amazingly all the colors recombined, and white light reemerged. He demonstrated that white light is in fact, made up of all the colors.67
Similarly, as rain falls, each water droplet acts as a tiny prism. As sunlight enters a water droplet, it slows down and undergoes refraction and dispersion, then it reflects off the inner wall of the rain droplet as it reemerges into the air, and it is refracted again and is separated into a rainbow of colors.8
In 1802, British scientist, William Hyde Wollaston, built a spectrometer and was the first to observe dark lines in the spectrum of the sun.9 Twelve years later, in 1814, German optician, Joseph von Fraunhofer, independently rediscovered these dark lines using a diffraction grating device that disperses light more effectively than a prism.10 He found and labeled over five hundred dark lines crossing the Sun’s spectra. These spectral lines are known today as Fraunhofer lines. Fraunhofer concluded that the relative positions of the lines are constant whether the spectra are produced by the direct rays of the Sun or by the reflection of light by the Moon, planets, or heated by metals in the laboratory. Between 1838 and 1846, Robert Bunsen, who created the Bunsen burner for use in flame tests for various metals and salts, teamed up with Gustav Kirchhoff. They noticed that several of the spectral lines produced on an absorption spectrum coincided with characteristic emission lines identified in the spectra of heated elements. Bunsen and Kirchhoff recognized they had a powerful tool since each element had its unique absorption and emission spectrum. This distinct “fingerprint” can then confirm the chemical composition of the Sun and fixed stars.11 By 1859, Bunsen and Kirchhoff identified many of the known elements’ spectra. And the solar eclipse of 1868 allowed for the discovery of the Helium lines in the Sun’s spectrum by the French scientist Janssen, though it took some time for scientists to accept that the lines were from a then-unknown substance, Helium.12 Janssen and an English scientist Lockyer independently proposed that the lines were from a new element, but it took about thirty years before their results were accepted – they had to wait until helium was discovered inside a uranium ore by Scottish scientist William Ramsay.13
Kirchhoff’s Three Laws
Rainbows are an excellent example of a continuous spectrum. In 1860, German physicist Gustav Kirchhoff was the first person to use spectroscopy to identify an element from sunlight. Kirchhoff’s experiments showed the three conditions that gave rise to the creation of the three general types of spectra: continuous, absorption, and emission (Image 2).14 Kirchhoff’s First Law states that a hot, opaque light source will produce a continuous spectrum with all colors present. Kirchhoff’s Second Law states that when a cool gas cloud is placed in front of a light source, the cloud’s atoms will absorb and produce a spectrum with dark lines – this is an absorption spectrum. The dark lines indicate the areas where the gas was absorbed for specific wavelengths of light. Kirchhoff’s Third Law states that when a hot gas cloud is placed in the absence of a light source, only bright lines appear and form an emission spectrum. These bright lines are the areas where the gas emits energy.
Image 2: Kirchhoff’s Law for Spectral Analysis
Photo Credit: Penn State University Department of Astronomy and Astrophysics, Creative Commons

Image 2: Kirchhoff’s Three Laws of Spectral Analysis for the creation of a continuous, absorption, and emission spectrum. A continuous spectrum forms when only a source of continuous radiation is present. This results in all the colors are present. When the continuous spectrum is viewed through the presence of relatively cool gas, absorption “dark” lines appear to form an absorption spectrum. When the hot cloud is seen without a light source behind it, then an emission spectrum appears.
The Dawn of Quantum Theory
At the start of the 20th century, more sophisticated experiments revealed the wave-particle duality of light. In some experiments, light behaves like a wave, and for others, it behaved like a particle. This particle or packet of energy is called a photon.15 German theoretical physicist, Max Karl Ernst Ludwig Planck discovered that energy comes in bundles called quanta for which he won the Nobel Prize in 1918. Planck proposed that energy radiated in very minute and discrete quantized amounts. He was able to determine that the energy of each quantum is equal to the frequency of the radiation multiplied by a universal constant that he derived, now known as the Planck constant, h.16 Planck was also able to explain the wavelength distribution of energy from black body radiation. For his work, Planck is considered the Father of Quantum Theory.
In 1905, Albert Einstein used Planck’s quantum theory to describe the particle properties of light. Einstein used it to explain the photoelectric effect.17 This Planck-Einstein relationship is a formula that states that quanta have a specific amount of energy, that only depends on the wavelength (E = h c/ λ, where E is energy, h is the Plank constant, c is the speed of light and λ is wavelength).18 Einstein’s photoelectric is a phenomenon in which electrons are ejected from a metal when photons of light are incident upon it. The photoelectric effect demonstrated the quantum nature of light and electrons. It was this work on the photoelectric effect that awarded him the 1921 Nobel Prize in Physics.
The Bohr Model
In 1922, Danish physicist Niels Bohr won the Nobel prize for his work that led to our understanding that electrons in an atom reside in specific energy levels around a nucleus and how that leads to radiation or absorption. Bohr developed a model of the atom that would explain certain regularities using the spectrum of hydrogen. As an electron moves from one energy level to the next, that difference in energy requires that it either emits a photon (when it moves from a higher-energy orbit to a lower-energy one) and produces an emission spectrum. When an electron absorbs a photon (when moving from a lower-energy orbit to a higher energy one) a photon is absorbed and an absorption spectrum is absorbed.19 The wavelength at which the photon is emitted corresponds to a color found in the visible light, as illustrated in (Image 3a).20
Using Image 3c, if an electron from hydrogen jumps from the sixth orbital to the second orbital, the energy difference corresponds to a wavelength of 420nm, this would give off a photon that has the color violet because light with wavelengths between 380-450nm is in the range for the color violet. Since it went to a lower energy level, this would produce a violet spectral line. If an electron goes jumps from the second energy level to the third, it went higher and so it would have to absorb this energy. If that energy difference corresponds to a wavelength of 656 nm, the spectrum would have a dark line in the red, because the wavelengths for the red-light area are between 620-750nm.
Image 3: Bohr Model of a Photon Emission and Hydrogen Spectral Lines
Photo Credit: ChemWiki, Creative Commons
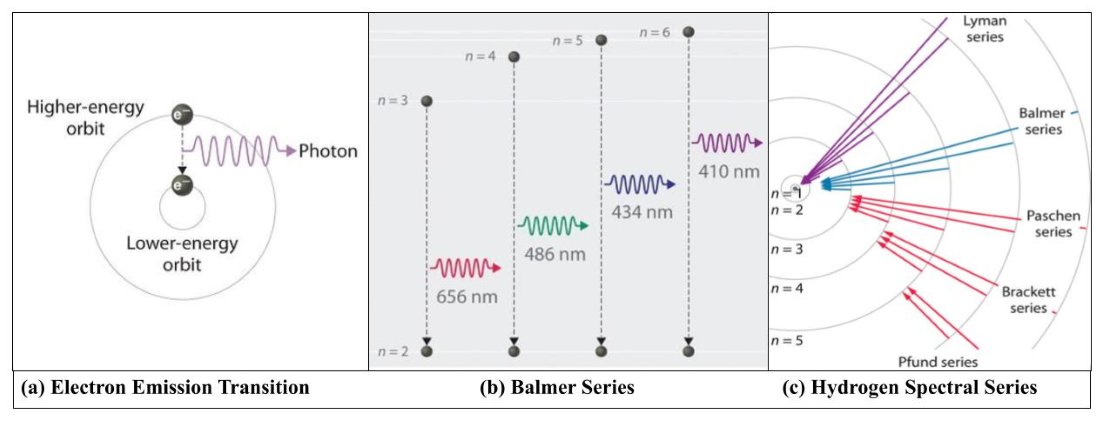
Image 3a: The emission of light by a hydrogen atom in an excited state when it transitions from a higher orbital energy level to a lower orbital energy level. Image 3b: Bohr sought to explain the Balmer series. Using this Bohr model, he explained that electrons are quantized. Balmer Series shows is specific for electrons that transition from the second orbital level. The difference in energy between the orbital energy levels corresponds to light in the visible portion of the electromagnetic spectrum. Image 3c: Hydrogen Spectral Lines are named after the scientists that observed them. Each series shows the electron transitions from a specific orbital level observed in the emission spectrum of hydrogen.
As students learn about the contributions of scientists to the development of spectroscopy and quantum mechanics, they should see that one pillar of the nature of scientific knowledge is that it builds upon the work of others and in the process, previous work can be built upon, refined, or debunked. For instance, Kirchhoff showed that each element had a unique spectrum, but his attempts to predict the frequencies of these spectral lines were unsuccessful until Swiss mathematician, Johann Jakob Balmer proposed an empirical formula for the wavelengths of four hydrogen spectral lines in the visible region.21 Balmer’s prediction was very successful, but he could not explain why his prediction worked. Niels Bohr sought to explain the Balmer series and in doing so he assumed that electrons orbit the nucleus at discrete or quantized orbits each with associated energy.22 As electrons transition to different orbital energy levels, they release or absorb electromagnetic radiation at a given wavelength that obeys the Planck-Einstein relationship.23
The Spectral Lines of Hydrogen
The spectrum of hydrogen is an important piece of evidence to show the quantized electronic structure of an atom.24 Hydrogen has the simplest atomic structure as it only has one electron in its outer shell. The atomic spectrum of hydrogen consists of several lines which have been grouped in five series. Each series is named after the scientist who observed it: Lyman, Blamer, Paschen, Brackett and Pfund [See Image 3c]. When hydrogen gas is heated to a high temperature or an electric discharge is passed, emission of electromagnetic radiation is initiated by the energetically excited hydrogen atoms.25 As an electron absorbs energy, they get excited and jump from a lower energy level to a higher energy level. Conversely, when they emit radiation, they return to their original state. This happens for any element, but hydrogen’s structure is the simplest with one electron in the outer shell, while others have more electrons and it gets complicated, which produces more complex spectra.26
Using hydrogen, these five scientists studied the different series of spectral lines that hydrogen has in different regions of the electromagnetic spectrum. For the Lyman series, electrons transition to and from higher orbits and the lowest orbital energy level which is also known as the ground state. This ground state is denoted, n=1. For the Balmer Series, electrons transition between higher orbits and the second orbital energy level n=2. For the Paschen series, electrons transition between higher orbital levels and the third orbital level, n=3. For the Brackett series, electrons transition between higher orbital levels and the fourth orbital energy level, n=4. Then for the Pfund Series, electrons transition between higher orbital levels and the fifth orbital level, n=5. The Lyman series of lines lie in the ultraviolet region of the spectrum, the Balmer series in the visible part, and the others in the infrared.27 Image 3c, illustrates how the emission spectra lines are produced as photons are emitted. Conversely, when the gas absorbs photons, the arrows in the diagram will reverse direction, and produce the dark lines of an absorption spectrum.
Spectral Lines: How to determine the chemical composition of stars
Like the unique pattern of a snowflake, each element also has its unique and identifiable emission spectral lines. Students will be given a sheet of Periodic Table of elements, unlike one that they have ever seen before. This Periodic Table of Elements will show the specific emission spectral lines of each element.
Students will be given copies of spectra of known elements such as hydrogen, helium, carbon, magnesium, and iron which are elements. They will then be put in groups. Each group will be given a star and asked to determine the chemical composition of the given stars. An online version of this activity called Star Spectra Gizmo by Explore Learning provides more in-depth activities to create more opportunities for students to explore, discover and apply new concepts.28 In the interactive Star Spectra Gizmo, students will determine the elements that a represented in each spectrum, use this information to infer the classification and temperature of the star. Once they have determined the elements present in their stars, they will share their information with the class. This is also an opportunity for the teacher to answer any questions and clear up any misconceptions.
Blackbody Radiation
The term blackbody radiation is used to describe the relationship between an object’s temperature and the wavelength emitted.29 All objects emit electromagnetic radiation, but a blackbody is an idealized model in which all light falling on it is absorbed.30 However, to stay in thermal equilibrium, a blackbody must emit radiation at the same rate as it absorbs and so it is a “perfect” absorber and a “perfect” emitter of radiation at all wavelengths.31 A German theoretical physicist, Max Planck, explained that a blackbody will completely absorb all radiant energy falling on it, then reach equilibrium and re-emit that energy. Experiments showed that the color of the radiation emitted was related to the temperature of the object. Think about a metal coil on your stove. As you increase the temperature on your stove, the coil gets hotter and glows from red to orange, to yellow and at even higher temperatures, this is not attained with ordinary stoves, you may even see the metal bright yellow or blueish white.32 No object is an ideal blackbody, but stars behave approximately like blackbodies, and as such using black body curves, astronomers can explain the temperatures associated with different colors.33 Most stars emit most of their energy in visible light, the dominant color of a star’s appearance is a rough indicator or “thermometer” of its temperature.34 See Image 4.
In 1911, German physicist, Wilhelm Wein, won the Nobel Prize in Physics, for his deduction of a blackbody radiation law, now called Wein’s Law. Wein’s displacement law formulated at what peak wavelength (λmax) is most intense at a given temperature.35 The blackbody radiation curve for different temperature peaks at a wavelength that is inversely proportional to the temperature. At cooler temperatures, the blackbody curve flattens, and the wavelengths increase (Image 4). Students will look closely and observe that cooler temperatures have a distribution peak at a higher wavelength and tend toward red (λmax ~700 nm at 4000K), while hotter temperatures, have shorter wavelengths and tend towards blue (λmax ~ 400 nm at 7000K).
This relationship is called Wein’s displacement laws and it helps determine the temperature of radiant objects such as stars.36 Humans also give off radiation, but we most strongly radiate in the infrared parts of the spectrum. With special infrared filtered cameras, because we most strongly radiate in the infrared parts of the spectrum, you can see then see our radiation.37 Max Planck explained why the black-body spectrum looks the way it does and why it depends on temperature. Stefan-Boltzmann Law states that the total power output of a body across all wavelengths is directly proportional to the temperature of the object raised to the fourth power (Intensity = σT4).38 Together, all three laws related to black body curves will be investigated using the Colorado PhET Blackbody Spectrum Simulation.39 At the end of this lesson, students will understand how astronomers use blackbody curves to understand the color, temperature, size, and luminosity of stars, and how this is used to categorize stars in the Hertzsprung-Russell Diagram.
Image 4: Blackbody Radiation Curves
Photo Credit: University Physics Volume 3
Creative Commons Attribution 4.0 International License

Image 4: The intensity of blackbody radiation versus the wavelength of the emitted radiation. The wavelengths corresponding to visible light are shown by colored bands. At lower temperatures, less energy is emitted, and the curve flattens. However, notice that at hotter temperatures, more photons/energy is emitted at all wavelengths.
The Doppler Effect
When you are at a stoplight, if you hear or see the flashing lights and sounds of an emergency vehicle, your sense of sight and sound helps you determine if the vehicle is moving towards or away from you. This is known as the Doppler Effect.40 The Doppler effect is the apparent change in frequency of light or sound waves due to the relative motion between the source of the wave and the observer. The Doppler effect is used in astronomy to determine if objects in the cosmos are moving towards or away from Earth.
Students should recall that longer wavelengths tend to the red region of the EM spectrum, while shorter wavelengths tend to the blue region of the EM spectrum. When the source of the wave moves, astronomers observe a shift in spectral lines. When an object is observed by astronomers to be moving towards the observer, the frequency increases and the wavelengths decrease, and they shift towards the blue end of the spectrum. This is called “blueshift”. When an object is moving away, the distance increases, which reduces the frequency, and the wavelengths increase and shift towards the red end of the spectrum. This is called “redshift”. Astronomers use the Doppler Effect to track the movements of stars, galaxies, meteorites, asteroids, and other cosmic debris by analyzing the color shift of spectral lines.
Observing Features of Our Sun
Most would describe the Sun as a hot yellow circle in the sky. The color of the sun may also be observed with red or orange hues, depending on the time of day, atmospheric conditions, and the presence of an eclipse.41 All their observations are done in the visible spectrum. But the Sun is seen, much differently when observed under different wavelengths of light that the human eye cannot see. In Feb 2010, NASA launched the Solar Dynamic Observatory (SDO), equipped with a suite of instruments to capture ultra-high-definition imagery of the Sun in 13 different wavelengths.42 [See Image 5]. Near-simultaneous images of the Sun are taken in each wavelength. Each wavelength is used to highlight a particular part of the Sun’s atmosphere, from the solar surface to the upper levels of the Sun’s corona. The SDO is designed to help us better see features of the Sun and understand the Sun’s influence on Earth and Near-Earth space by studying the solar weather, solar magnetic field, and on small scales of space and time in many wavelengths simultaneously. The SDO is equipped with three powerful instruments: The Atmospheric Imaging Assembly (AIA), Helioseismic and Magnetic Imager (HMI), and the Extreme Ultraviolet Experiment (EVE).
Atmospheric Imaging Assembly
The Atmospheric Imaging Assembly (AIA) images the outer layer of the Sun’s corona, at all temperatures from 20,000 -20,000,000 million degrees.43 of the sun using multi-wavelength filters on telescopes and cameras. These different wavelengths reveal remarkable high-definition (HD) features of the sun Each filter simultaneously captures images of the physical properties of the sun every 10 seconds, significantly improving our understanding of the 11-year solar cycle, solar flares, sunspots, magnetic fields, solar storms, and coronal mass ejections (CMEs).44 The image shows dark-colored sunspots in visible light (yellow backdrop), shows sunspots as bright glowing ribbons of looping magnetic fields in ultraviolet light (green wedge). In the far-ultraviolet light, the photosphere appears dark because a black-body spectrum at a temperature of 5700 Kelvin emits very little light in this wavelength. If we compare these filters from 170 nm to 9.3nm, we see that the “edge” of the sun’s atmosphere is captured in more detail and appears at different heights.
Image 5: Solar Dynamics Observatory Multiwavelength Images of the Sun.
Photo Credit: Brian Dunbar, NASA
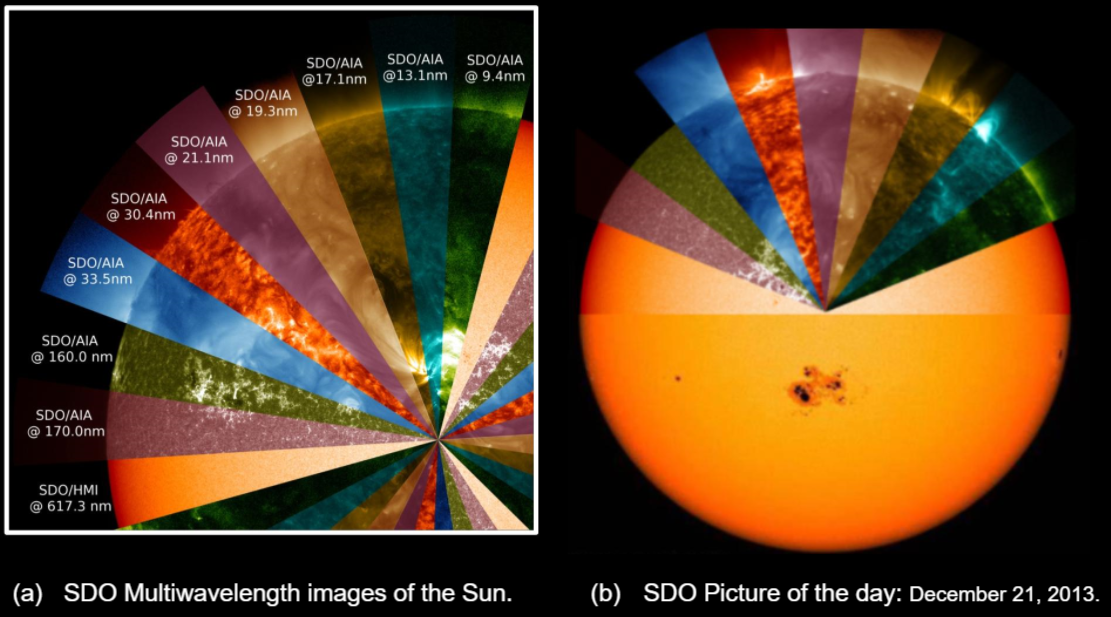
Image 5a. The Solar Dynamics Observatory (SDO) Multiwavelength images of the Sun in the visible, extreme ultraviolet, and x-rays (617.3nm - 9.13nm). Image 5b. Against a base image of the sun, the wedge-shaped segments this was the NASA SDO Picture of the day on December 21, 2013. This image comparatively shows the increase in ultra-high-definition imagery that able to see solar flares, magnetic fields, and other features of the sun.
Helioseismic and Magnetic Imager
A second instrument called the Helioseismic and Magnetic Imager (HMI) on the Solar Observatory, is designed to measure oscillations and the magnetic field at the solar surface, or photosphere. HMI looks at the outside of the sun and tries to determine what goes on the inside.45 Billions of ripples caused by the Sun’s convection zone are little, but like shocks from an earthquake. The HMI will measure the ripples on and magnetic field on the photosphere. HMI carefully analyzes the sound of seismic waves to understand what happens under the surface of the sun. Another function of HMI is to then produce a map of the Sun’s magnetic field. The Sun has numerous and extremely complicated magnetic fields, and when they combine, they create active regions. It is important to study the magnetic field of the Sun because it affects our climate and its space weather. Space weather event from the Sun puts out dangerous radiation to our astronauts, interfering with satellites. A region of strong magnetic fields can result in a coronal mass ejection and solar flares which can cripple power grids and communication systems.46
Extreme Ultraviolet Experiment
SDO’s Extreme Ultraviolet Experiment (EVE) measures the solar radiance at the ultraviolet (UV) sand extreme ultraviolet radiation wavelengths. These are extremely short wavelengths. They are usually absorbed in the upper layers of the Earth’s atmosphere where the ozone layer traps UV radiation. EVE measures the amount of solar irradiance and provide warnings about the dangers of flares to astronauts, and communications on earth that there will be problems with their equipment.47
The Daniel K. Inouye Solar Telescope
The surface of the sun is boiling! The Daniel K. Inouye Solar Telescope (DKIST) captured first of its kind images of the sun's granular surface.48 The DKIST is a four-meter-diameter solar telescope located on the island of Maui, Hawaii. In July 2020, DKIST captured high-resolution images showing real images of revealing convection granules the size of Texas on the surface of the sun. These images are remarkable, but of particular interest to scientists are the magnetic fields, which can result in powerful solar storms capable of knocking out power grids.49 Scientists hope that by understanding solar storms, they can develop an early warning system to warn of possible obstruction to our technological systems.
Comments: