Content Objectives
This unit is divided into three major sections. The first focuses on human population over time, including the environmental conditions and constraints that kept populations from growing significantly. The second and largest section of the unit focuses on the Demographic Transition Model and how it predicts and explains the demographic changes a country undergoes as a result of economic growth and development. This section will also cover concepts such as fertility, the Human Development Index, and population pyramids, as those topics will help students develop a deeper understanding of the Demographic Transition Model. The third and final section provides an overview of the environmental consequences associated with population change (though this is limited to an overview and leads into a separate curriculum unit). After completing this unit, students are able to: explain how human populations change in reaction to a variety of factors, including societal and cultural factors; explain the socioeconomic and environmental issues that arise from a changing population; and describe patterns or trends in data and use them to support evidence-based analysis and conclusions related to environmental concepts, processes, or models.
Human Population through Time
Throughout most of human history, the world population was around 1 million individuals, kept in check by scarce resources, disease, and climate fluctuations.6 Scientists have even discovered several bottlenecks where the global population likely dipped into the tens of thousands.7 The advent of agriculture allowed populations to grow slightly to around 2.5 million by 10,000 BCE. As is spread into multiple regions, the world saw the population continue to rise steadily, reaching 115 million by the year 1 BCE. 1000 years the later the population had reached nearly 300 million. This means that during this time the population was doubling about every 400 years. The world population reached the 1 billion milestone in 1804 and was now doubling every 240 years. The 2 billion milestone was reached in 1927, just 123 years later. Human population was now growing exponentially larger, and doubled to 4 billion people only 47 years later in 1974.8 As of June 2021, the world population is 7.88 Billion.9 While this number is astronomically higher than the roughly 1 million individuals that the planet is most used to, it does show that growth has slowed, as we have not yet doubled in the past 47 years. The growth in human population described above can be modeled using the Demographic Transition.
Demographic Transition
The Demographic Transition Model (DTM) is the phenomenon by which developing countries undergo specific, predictable changes in population as they modernize.10 There is some debate on the number of phases of the DTM, but for the purposes of AP-ES, there are four: the Pre-Industrial Phase, the Transitional Phase, the Industrial Phase, and finally the Post-Industrial Phase. Each phase is characterized by the country’s birth and death rates (as shown in Figure 1). It is also useful to discuss fertility rates and some key economic and technological characteristics exhibited by countries in each stage.11
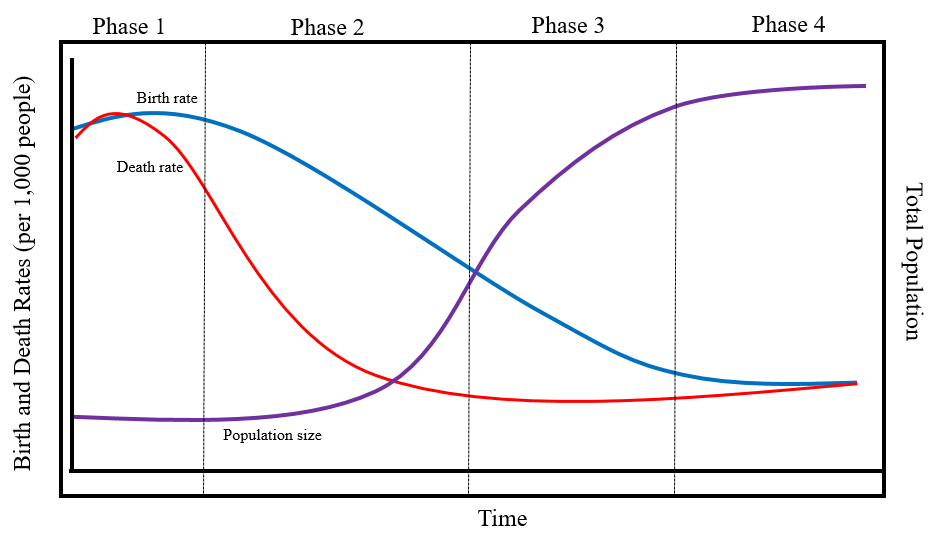
Figure 1: The Demographic Transition Model describes the observable trends in human population metrics as a country’s economy undergoes modernization.
Demographic Vocabulary
Before students can dig deep into the DTM, they need to understand some specific vocabulary terms. These include crude birth and death, population growth rate, total fertility rate, replacement-level fertility. It is also useful to introduce the terms developed and developing country here (the limitations of these terms are discussed later). A country’s birth rate is defined as its number of live births per 1,000 individuals. Likewise, its death rate is the number of deaths per 1,000 individuals. Ignoring immigration and emigration, population growth equal to the crude birth rate minus the crude death rate, divided by 10. A country’s total fertility rate (TFR) is defined as the average number of children that each woman will bear throughout her childbearing years. Replacement-level fertility is the TFR required to offset the average number of deaths in a population in order to maintain the current population size. Developed countries are defined as those with relatively high levels of industrialization and income, while developing countries are those with relatively low levels of industrialization and income.12 These definitions provide students the necessary vocabulary to understand and then analyze the DTM.
Phases of the DTM
The first phase of the DTM is the Pre-Industrial Phase. A country in this phase experiences little to no population growth due to nearly equal birth and death rates. The populations may also experience contraction for a several reasons, including epidemic, war, famine, etc. Birth rates are high because of high infant and child mortality. Demographers have made generalized observations that because parents know it isn’t likely that each child will survive, they have as many as possible.13 Children represent economic value in that they can work on farms or other labor settings (like cobalt mines in the Democratic Republic of the Congo) and are expected to provide care as their parents age. TFR is high to compensate for a high degree of infant and child mortality. Currently no entire country is in this phase; however, indigenous tribes in the Amazon or in Sub-Saharan Africa likely exhibit these characteristics (along with remote populations of various countries). Economically, this phase is characterized by subsistence agriculture or hunting/gathering, little (if any) access to modern sanitation and public health infrastructure, and an overall scarcity of resources. This phase is the “default setting” for the human species (recall that it took over 100,000 years for the global population to reach one billion people).14
The next phase is the Transitional Phase. The Transitional Phase is perhaps the most important because of its impact on population and the associated strain on societal and environmental resources. In this phase, advances in technology allow for a rapid decline in mortality. Examples of such technology range from agricultural improvements such as irrigation and mechanization that increase food supply and security to public infrastructure. Population growth rates accelerate in this phase because although death rates have dropped due to improvements in public health infrastructure, birth rates are still high. TFR is still high, though typically less than in Phase 1. This can largely be explained by two phenomena: a lag in economic shifts away from traditional agriculture and other forms of subsistence activities where children provide labor, and a lag in the cultural views on having many children. This still-high birth rate in turn leads to rapid population growth because birth rates remain high above death rates.15 Nigeria, Pakistan, Mozambique, and India are prime examples of countries in the middle of the transitional phase.
As countries move into an industrial economy, their population enters into the Industrial Phase. Here, birth rates begin to fall as families decrease the number of children they have. There are several factors that result in this drop: the increased education of women, use of modern family planning and contraception, and a cultural and economic shift in the perspective of children. Death rates approach their minimum during this phase, and population growth slows and eventually begins to level off. TFR begins to approach RLF in this phase as the birth rate converges on the death rate.16 Urbanization, access to technology, and quality of life are typical in this phase. Examples of countries currently in this phase of the DTM include the US, Mexico, and Canada.
Finally, in the Post-Industrial Phase of the DTM, birth rates equal and may decrease below death rates. Populations stabilize or even contract during this phase as TFR equals or is sometime less than RLF. Italy, Japan, and Germany are examples of countries that have entered the Post-Industrial phase and experienced population stagnation or contraction. Whereas countries in Phases 2 and 3 are worried about growing populations, those in Phase 4 are concerned on the negative effects of a stagnant or contracting population, which include higher costs of social security, pensions, and healthcare for an aging population, a smaller tax base, and a shortage of workers.17
Encouraging a Deeper Analysis of the DTM
It is important for students to understand that the DTM is merely one model with certain generalizations and limitations. Perhaps the biggest flaw in the DTM is the tendency to use it in order to separate countries into two poorly defined categories: developed and developing. These terms rely on income and industrialization levels, which is problematic for several reasons. First, it results in otherwise impossible associations. For example, Mexico and Mozambique are both considered developing countries, despite being vastly different in virtually every other aspect. Second, the terms imply that developed countries are in a sense “finished” and the gold standard, while developing countries should aspire to be like their developed counterparts. Third, beyond the narrative that higher incomes lead to better quality of life, these terms do little to account for the personal experiences of those who live there.18 Instead of strictly using developed and developing, it is more prudent to use the Human Development Index and think of development less in terms of binary and more as a spectrum.
The Human Development Index (HDI) is a more comprehensive indicator of a development than income and industrialization alone. It factors in life expectancy, education, and standard of living into a figure that can be compared with other countries. The UN explains it as a “summary measure of average achievement in key dimensions of human development: a long and healthy life, being knowledgeable and having a decent standard of living. While Mexico and Mozambique may both be considered developing countries, they have very different HDIs. Mexico has an HDI of 0.779 and Mozambique comes in at 0.456. Mexico ranks in the high human development category, while Mozambique is in the low human development category. Further analysis reveals that Mozambique lags behind Mexico in all three factors but has shown significant growth since 1990. India lies somewhere between these two countries, with an HDI of 0.645, even though it is also considered a developing country. Digging deeper into the data reveals that Mozambique has significantly less education than both Mexico and India. As the DTM indicates, education (specifically of girls and young women) is critical to improving outcomes. Knowing this, organizations such as the UN and World Bank can target their efforts more specifically to increasing educational infrastructure and opportunity in Mozambique.19
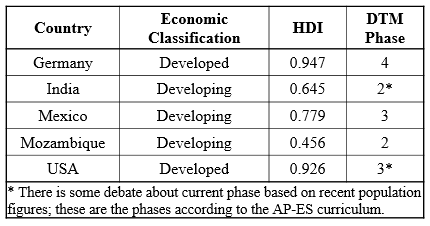
Table 1: Demographic and economic indicators for case study countries20, 21
Even with those limitations in mind, there are several reasons why the DTM remains a hallmark of demography. Perhaps the most important reason to understand the DTM is to close the gap in terms of the HDI and usher in a higher quality of life in developing countries. Currently there is a significant gap in the health status between developed and developing countries. In most developed countries the leading causes of death are noncommunicable diseases (illnesses that are not spread from person to person) like cancer, ischemic heart disease, and stroke. In the developing world, deaths from communicable diseases (illnesses that spread from person to person) like tuberculosis and malaria are far more prevalent. For example, a child in a developed country is more than 1000 times likely to die from a measles infection than one born in a developed country, owing largely to the lack of preventative medicine and access to adequate treatment. Malnutrition is also rampant in developing countries, which only compounds the effects of infectious diseases and other illnesses.22 Additionally, providing populations with adequate reproductive technology (including contraceptives) is vital to slowing the rapid population growth countries undergo during the DTM. Providing such technology eases the population bomb that occurs in Phases 2 and 3 until cultural shifts begin to take hold and families begin choosing to have fewer children.23 A comprehensive understanding of the DTM can also help governing agencies plan for the future with regards to infrastructure, agricultural needs, and environmental consequences.
Connecting Demographic Concepts: the DTM and Population Pyramids
Like many of the topics in AP-ES, knowing the phases of the DTM and how countries move from one to the next is only the beginning. Students should be able to make connections between other concepts and the DTM. The most obvious of those connections is with Population Pyramids (or Age-Structure Diagrams). This tool is an excellent way of visualizing the population of a country and making predictions about where it lays on the DTM and where it is likely to go in the future. They are visual representations of the number of individuals within specific age groups for country, expressed for males and females. Most diagrams split age groups into five-year increments, which are then represented on the y-axis. The x-axis of the diagram is the percentage that demographic represents in the whole population.24 In previous years I have spent extensive time teaching students how to generate such diagrams from population data, but haven’t gone much deeper. However, I think it is more important for students to be able to interpret and analyze the diagrams, make connections to the DTM, and then think about the environmental, social, and economic consequences of a particular diagram shape. Much can be said about these consequences by examining and comparing population pyramids for different countries, such as in Figure 2 below.

Figure 2: Population pyramids for case study countries (data from US Census Bureau International Database)25
For example, the economic, social, and environmental pressures faced by a rapidly growing Mozambique are vastly different than those facing an aging and declining population in Germany. These differences should be front and center when designing or adapting technologies to alleviate such pressures. These diagrams are also an excellent link between demographic concepts because their shapes fit nicely with the population growth aspect of the DTM. For instance, Mozambique’s classic pyramid shape indicates rapid population growth, putting it in Phase 2 of the DTM, while Germany’s slightly inverted pyramid is consistent with Phase 4. These next-level connections are a hallmark of the AP-ES curriculum.
Role of Biotechnology in Improving HDI
Biotechnology is critical in Phases 2 and 3. Of specific interest are those technologies that decrease the transmission and severity of infectious diseases because they dramatically increase the survival of infants and children under five years. Vaccines are chief among these developments. They work by stimulating the immune system to enhance the body’s natural defenses, and are classically defined as a preparation of all or part of an infectious agent that primes the immune system to recognize a disease without causing the disease. For instance, the development and dissemination of vaccines has successfully eradicated Smallpox, even in countries in the early phases of the DTM. Efforts are also underway to eradicate polio worldwide with a focus on countries such as India, Pakistan, and Somalia. Vaccination against tuberculosis has already greatly reduced incidences and deaths in many countries in this phase.26 Additional engineering innovations for ensuring access to clean water and sanitation have gone a long way towards reducing risk of death from communicable diseases. Doing so requires the expansion and improvement of sanitation. Such innovations have provided a roadmap toward increased health and quality of life for individuals living in economies that lag behind in terms of modernization.27
Adeptly applied biotechnology can also offer solutions to limit the population explosions often seen here through access to contraceptives, as well as improve the quality of life for individuals in lower HDI countries suffering from noncommunicable diseases like asthma or diabetes by developing low-cost and technologically appropriate preventative, diagnostic, and treatment options. Even more critical is that many countries, specifically in Sub-Saharan Africa and Southeast Asia are seeing dramatic increases in noncommunicable diseases as their life expectancy increases. Currently their public health infrastructures are not capable of dealing with high levels of both communicable and noncommunicable disease.28 Additionally, as cities become more crowded with cars, trucks, and buses, and as climate change worsens, the negative environmental consequences will only exacerbate certain illnesses, including chronic respiratory diseases like asthma, chronic bronchitis, and lung cancer.29
Environmental Consequences of Population Change
The two biggest current environmental consequences of a growing population are CO2 emissions and urban land use.30 Both of these consequences are individual topics in my AP-ES class, so this unit provides only a preview of them. IPAT and ecological footprints are also introduced as a way of measuring the impact of population changes on the environment.
CO2 Emissions
Increased CO2 emissions are of concern because of their connection to global climate change. As the UN reports, CO2 emissions have increased in lock-step with population growth since the 1700s. As more people exist on the planet, they consume more resources, many of which emit carbon at some point during their production and/or consumption. For example, more people means more agricultural production, which in modern times is carbon intensive due to synthetic fertilizers and a de-localized supply chain. Additionally, as countries modernize their reliance on cars and energy consumption increase, significantly increasing their CO2 emissions. Aside from a systematic reduction in food waste along the agricultural supply chain, lowering population growth has the most potential to reduce CO2 emissions worldwide. In fact, population growth is such a concern that the IPCC declared it a significant impediment to limiting global warming by 1.5 oC by the end of the century.31
Urban Land Use
Urban land use poses a variety of challenges to the environment, including increased stormwater runoff, urban heat islands, degraded water quality, and losses of biodiversity.32 As natural or agricultural lands are converted to urban or suburban lands, their percentage of impervious surfaces increases dramatically. In response, that area becomes subject to increases runoff and localized flooding, both of which have negative environmental consequences, including erosion of stream banks, alteration of stream/river hydrology, transfer of surface pollutants into local surface water bodies, and damage to critical infrastructure.33 Urban heat islands occur when areas with a great deal of human infrastructure are considerably warmer than their less developed surroundings.34 The biggest historical consequence of a growing population is deforestation and biodiversity loss, especially in Western Europe and North America.35 When virgin forests are cleared to make room for human developments or agricultural lands, those ecosystems are permanently degraded. While this issue is less pronounced in countries further along the DTM (in fact there is some evidence of reforestation) it remains a critical environmental threat in the Amazon, Central African, and Equatorial Pacific rainforests.36 Each of these impacts are discussed in future units of study in my AP-ES curriculum.
IPAT and Ecological Footprints
Since CO2 emissions and urban land use constitute their own units, students need another way of discussing the environmental impacts of population growth. There are two methods of measuring and analyzing this impact with which students should be familiar: IPAT and ecological footprint. The IPAT equation is one way of estimating the impact of a human lifestyle on the environment by considering population, affluence, and technology. While it appears as a mathematical equation, IPAT is more of a conceptual representation of environmental impact. As population increases, so does environmental impact. More affluent people consume more resources than less affluent ones, thereby increasing impact.37 Typically, increases in technology lead to more impact, though this not is always true as engineers increasingly factor in environmental impact into the design and manufacturing processes.
While limited by assumptions and generalizations, the IPAT equation is a solid way of comparing the impacts different countries have on the environment. It is especially powerful when it leads into a discussion of ecological footprints. The Global Footprint Calculator has produced data in line with what we would expect from an analysis of IPAT: countries with a lower HDI (specifically lower income) have a lower per capita footprint. India has a per capita footprint of 1.1 hectares, while Mexico and the US have footprints of 2.6 and 8.6 hectares, respectively.38
Comments: