Framework for Mathematical Discourse and Schema Building
I have created a framework to address all Process Standards as students discover patterns and schema. Students are provided a word problem scenario. Then they are asked to work in collaborative groups to formulate questions that could be answered using particular operations. After the questions are developed, the students share them. The collaborative groups then figure out how to organize them based on the number of steps and the solutions. Throughout the process students will communicate with each other to explain their thinking. They will reason as they determine how to represent, solve, and categorize the problems. As patterns emerge between the problems that are solved with the same tape diagram, connections will be made.
Module 1: Place Value, Rounding, and Algorithms for Addition and Subtraction
The first scenario is from Module 1, Lesson 12 Problem Set. I chose this problem specifically because it presents the information in a chart. The chart will provide students a method to represent data and serve as a visual model to organize their thinking. The chart also makes problem solving more accessible for students as it will seem less daunting for English Language Learners and reluctant readers. The simplicity of the chart will provide a level of comfort as students embark on their journey creating problems, identifying similarities, finding solutions, and discussing them.
During National Recycling Month, Mr. Yardley’s class spent 4 weeks collecting empty cans to recycle (see Table 1). During Week 2, Mr. Yardley’s class collected 1,256 more cans than they did during Week 1.
First the students should solve for the number of cans collected in week 2. It would be helpful at this point to put the number of cans for week 2 on the chart.
|
Week |
Number of Cans Collected |
|
1 |
10,827 |
|
2 |
|
|
3 |
10,522 |
|
4 |
20,011 |
Table 1: Cans collected by Mr. Yardley’s class.
The tape diagram (see Figure 1) shows how Eureka Math would approach using the tape diagram. The equation is written using a variable and solved.
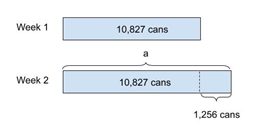
Figure 1: Tape diagram to find the number of cans collected during week 2.
a = 10,827 cans + 1,256 cans
= 12,083 cans
With the chart displayed for students, I will have them work in collaborative groups to create word problems using addition and subtraction. Once they have written some problems, I will ask some groups share them with the class. I will record the shared problems on a Google Slide or a PowerPoint to display them. Then, I will have the collaborative groups decide which problems are similar and how to categorize them. If students need more scaffolding, I will suggest that they first solve them. Then they could sort them by the operation, or the number of steps required.
Below (see Table 2) are the most likely one step addition problems they could develop.
|
One-Step |
Operation |
Answer |
|
How many cans were collected in weeks 1 and 2 combined? |
+ |
22,910 |
|
How many cans were collected in weeks 1 and 3 combined? |
+ |
21,349 |
|
How many cans were collected in weeks 1 and 4 combined? |
+ |
30,838 |
|
How many cans were collected in weeks 2 and 3 combined? |
+ |
22,605 |
|
How many cans were collected in weeks 2 and 4 combined? |
+ |
32,094 |
|
How many cans were collected in weeks 3 and 4 combined? |
+ |
30,533 |
Table 2: One-step questions for can collection scenario
The tape diagram (Figure 2) below illustrates one way to represent one-step addition.
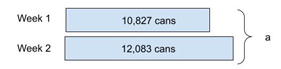
Figure 2: Tape diagram for one-step addition problems
Here is another way a one-step addition problem could be modeled with a tape diagram.
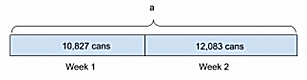
Figure 3: Another tape diagram for one-step addition problems
No matter which tape diagram model is selected, the equation would be the same.
a = 10,827 cans + 12,083 cans
Students could also create the following one-step subtraction problems (see Table 3).
|
One-Step |
Operation |
Answer |
|
How many more cans were collected in week 1 than in week 3? |
- |
305 |
|
How many more cans were collected in week 2 than in week 1? |
- |
1,256 |
|
How many more cans were collected in week 2 than in week 3? |
- |
1,561 |
|
How many more cans were collected in week 4 than in week 1? |
- |
9,184 |
|
How many more cans were collected in week 4 than in week 2? |
- |
7,928 |
|
How many more cans were collected in week 4 than in week 3? |
- |
9,489 |
|
How many fewer cans were collected in week 3 than in week 1? |
- |
305 |
|
How many fewer cans were collected in week 3 than in week 2? |
- |
1,561 |
|
How many fewer cans were collected in week 1 than in week 2? |
- |
1,256 |
|
How many fewer cans were collected in week 1 than in week 4? |
- |
9,184 |
|
How many fewer cans were collected in week 2 than in week 4? |
- |
7,928 |
|
How many fewer cans were collected in week 3 than in week 4? |
- |
9,489 |
Table 3: One-step subtraction problems for can collection scenario
All the one-step subtraction problems in Table 3 could be solved with a similar tape diagram to the one below, but the labels and the numbers would be different as would the equation.
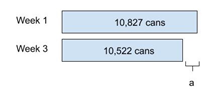
Figure 3: Tape diagram for one-step subtraction
a = 10,827 - 10,522
The following table (see Table 4) includes possible two-step addition problems students may create.
|
Two-Step |
Operations |
Answer |
|
How many cans were collected in weeks 1, 2, and 3 all together? |
+, + |
33,432 |
|
How many cans were collected in weeks 1, 2, and 4 all together? |
+, + |
42,921 |
|
How many cans were collected in weeks 2, 3, and 4 all together? |
+, + |
42,616 |
Table 4: Two-step addition problems for can collection scenario
All the problems of this type could be solved with the same tape diagrams (see Figure 4 and Figure 5) by substituting the appropriate quantities for the corresponding weeks.
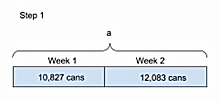
Figure 4: Tape diagram for the sum of 2 weeks
a = 10,827 cans + 12,083 cans
22,910 cans
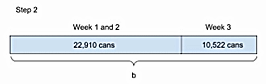
Figure 5: Tape diagram for sum of 3 weeks
b= 22,910 + 10,522 cans
b = 33,432 cans
Below are possible two-step problems (see Table 5) that students may create that use addition and subtraction to solve them. They follow the schema where the number of cans for 2 different weeks are combined through addition, then the sum for two weeks is compared to a third week which requires subtraction.
|
Two-Step |
Operations |
Answer |
|
How many more cans were collected in weeks 1 and 2 combined than in week 4? |
+, - |
2,899 |
|
How many more cans were collected in weeks 1 and 3 combined than in week 4? |
+, - |
1,338 |
|
How many more cans were collected in weeks 2 and 3 combined than in week 4? |
+, - |
2,594 |
|
How many more cans were collected in weeks 1 and 2 combined than in week 3? |
+, - |
12,388 |
|
How many more cans were collected in weeks 1 and 3 combined than in week 2? |
+, - |
9,266 |
|
How many more cans were collected in weeks 2 and 3 combined than in week 1? |
+, - |
11,778 |
Table 5: Two-step addition and subtraction
The tape diagram below shows joining the number of cans for Week 1 and Week 2, then comparing the sum to the number of cans collected in Week 4. All the problems (see Table 5) could be solved with the same tape diagram by substituting different weeks and the corresponding numbers.
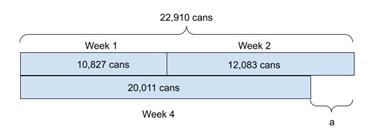
Figure 6: Tape diagram for two-step addition and subtraction
10,827 cans + 12,083 cans = 22,910 cans
a = 22,910 cans - 20,011 cans
a = 2,899 cans
Module 3: Multi-Digit Multiplication and Division
The following scenario comes from the Grade 4 Module 3 Lesson 12 Problem Set problem #2: The Turner family uses 548 liters of water per day. The Hill family uses 3 times as much water per day.
I have removed the question posed, in the text, as I want the students to generate questions that could be asked for the scenario.
Here is a sample of possible questions that students might develop:
- How much water does the Hill family use in a day?
- How much more water does the Hill family use than the Turner family in a day?
- How much less water does the Turner family use than the Hill family in a day?
- How much water does the Hill family use in a week?
- How much more water does the Hill family use than the Turner family in a week?
- How much less water does the Turner family use than the Hill family in a week?
- How much water do the Turner and Hill families use in a day combined?
- How much water do the Turner and Hill families use in a week combined?
I will ask students to share out their question and record them on a Google Slide or PowerPoint. Then have the students categorize them by the number of steps required to solve each problem. This will create a wonderful opportunity for some mathematical discourse. The table below (see Table 6) shows how the problems could be categorized. Next, I would have the class discuss the problems in small groups. If there is limited time, a small group could have 2 to 3 problems to solve.
|
1 Step |
2 Step |
More than 2 Steps |
|
#1 |
#2 |
#5 |
|
#7 |
#3 |
#6 |
|
#4 |
||
|
#5 |
||
|
#6 |
||
|
#8 |
Table 6: Problems sorted by the number of steps.
Students can share their tape diagrams (see Figure 7) and their solution paths with the class.
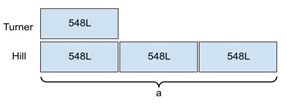
Figure 7: Tape diagram for one-step multiplicative comparison
For Problem #1: How much water does the Hill family use in a day? The students should multiply 548 X 3 (see Figure 7). Students may use addition, but this problem is an example of a multiplicative comparison problem.
The next two problems ask essentially the same question, but they ask it in different ways.
Problem #2:
How much more water than the Turner family does the Hill family use in a day?
Problem #3:
How much less water does the Turner family use than the Hill family in a day?
Both these problems are represented with the same tape diagram (see Figure 8).
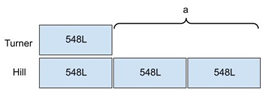
Figure 8: Tape diagram comparing daily water usage by the Hill and Turner families
Problem #4 asks:
How much water does the Hill family use in a week?
The students would multiply 548L by three and determine that the Hill family uses 1,644 L of water in a day (see Figure 9). Then they would multiply 1,644 by seven days to get 11,508 L of water per week (see Figure 10).
Step 1:
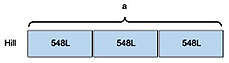
Figure 9: The tape diagram shows daily water usage for the Hill family
Step 2:
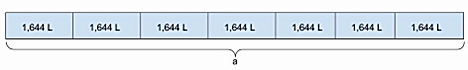
Figure 10: The tape diagram shows Hill water usage for 1 week.
Like Problems 2 and 3, Problem 5 and Problem 6 are the same question, but students may approach them differently. It would be worth discussing how the wording makes the problems appear different, but they are the same.
Problem #5:
How much more water does the Hill family use than the Turner family in a week?
Problem #6:
How much less water does the Turner family use than the Hill family in a week?
Both problems compare the difference in the amount of water used. These two problems will likely generate a robust discussion. The problems are “Comparison More” and “Comparison Less” with the same scenario. And both are “Difference Unknown.”
The shortest solution path is to multiply 548L by two to get 1,096 L, then multiply 1,096L by seven to find 7,672 liters of water. However, some students will do 548L X 3 = 1,644L as the first step, then 1,644L X 7 = 11,508L as the second step. The third step may be . The fourth step may be to subtract 11,508 - 3,836 = 7,672L.
Another possible way to solve the problem would be 548L X 7 = 3,836. Then multiply 3,836 times 3 to get 11,508. The final step would be to subtract 11,508 minus 3,836, and the answer would once again equal 7,672 liters. Students can discuss the number of steps required to solve the problem which could lead them to understand that while all the solution paths are correct, the one with the fewest steps is better as it reduces the chance for computational errors. Using fewer steps also saves time.
Problem #7: How much water do the Turner and Hill families use in a day combined?
could be solved with multiplication or addition. With multiplication the students would use 548L X 4 = 2,192L. This would involve reasoning that 3 times some amount plus the amount makes 4 times the amount. This is nice reasoning and uses the Distributive Rule. If any student does it this way, it would be worth showcasing it in a class discussion. The Hill and Turner families together use 2,192 Liters of water per day.
Problem #8 could build on problem #7. Problem #8 asks: How much water do the Turner and Hill families use in a week combined? If the Hill and Turner families use 2,192 liters of water in a day, then 2,192 liters times 7 would equal 15,344L. The Turner and Hill families use 15,344 liters of water in a week.
Students could then take the 2-Step problems and categorize them by the operations (see Table 7). Since problems #5 and #6 can be solved with two steps, I included them in the table below. This would provide a wonderful opportunity for student discourse. It would lead to an authentic conversation to help students who used three or four steps to see a higher-level solution.
|
Problem |
Operations |
Operations |
|
#2 |
X; — | |
|
#3 |
X; — | |
|
#4 |
X; X | |
|
#5 |
+; X or X, X |
X; X |
|
#6 |
+, X or X, X |
X; X |
|
#7 |
X, + | +, X |
|
#8 |
X; X |
Table 7: Problems #1-8 sorted by the operations needed to solve them.
Module 5: Fraction Equivalence, Ordering, and Operations
The next scenario is from Module 5, which is about fractions, and offers the opportunity for multi-step problems with fractions. For Virginia teachers, this activity will go beyond the grade 4 mathematics Standards of Learning (4.5), which only requires students to solve 1-step problems with fractions. The teacher can impose a constraint so the students only write one-step problems to stay within the standard, but this would be detrimental to the thinking and discourse, as there are only three one-step problems that could be written. The exercise could be a small-group activity for students who are ready for a challenge. Or, if students are solving a lot of word problems, engaging in discourse, and thinking critically, they are probably capable of solving these problems. This is problem is from Grade 4 Module 5, Lesson 18 Problem Set problem #3.
In a fish tank ¾ of the fish are guppies, 1/6 of the fish are goldfish, and the rest of the fish are angelfish.
Here are some examples of problems students might create using this scenario. They may word them more simply in a more child-friendly language. Record the problems as students share them. Then have students solve the problems created. For the sake of time, it is probably best to have each group work on one or two problems. There can be some overlap. Then guide the students to discuss and categorize the problems based on the number of steps needed to solve each one (see Table 8).
- What fraction of the fish are angelfish?
- What fraction of the fish are guppies or angelfish together?
- What fraction of the fish are goldfish or angelfish together?
- As a fraction of the total, how many more guppies are there than goldfish?
- As a fraction of the total, how many more guppies are there than angelfish?
- As a fraction of the total, how many more guppies are there than goldfish or angelfish combined?
- As a fraction of the total, how many more guppies or angelfish combined are there than goldfish?
|
1 Step |
2 Step |
More than 2 Steps |
|
#1 |
#3 |
|
|
#4 |
#2 |
#5 |
|
#6 |
||
|
#7 |
Table 8: Problems #1-7 sorted by the number of steps needed to solve
Students should share their solutions and tape diagrams (see Figure 11) as they reason and justify their answers.
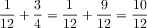
Problem #1: What fraction of the fish are angelfish? This is a two-step problem. The first step is what fraction of the fish are guppies or goldfish? This is 11/12. Then the angelfish are 1 - 11/12 = 1/12.
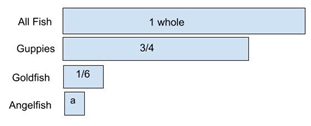
Figure 11: The tape diagram represents the fraction of each type of fish in the aquarium.
Students would add the fraction of guppies to the fraction of goldfish. Students would have to find like denominators to calculate the sum of guppies and goldfish.


Problem #2: What fraction of the fish are guppies or angelfish together? Problem #2 is a three-step problem. First, students need to find the fraction of fish that are angelfish. This is a two-step problem, with solution as described above. Then they subtract the resulting fraction from 1 whole to determine the fraction of fish that are angelfish. The third step is to add the fraction of angelfish to the fraction of guppies.


If students reason guppies and angelfish are the whole minus the goldfish, it is one step. I will ask whether any students solved it differently, in hopes of eliciting this solution. However, if no student came up with this solution, I will not introduce it myself.
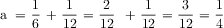
Problem #3: What fraction of the fish are goldfish or angelfish together? Problem #3 is a three-step problem. The students follow the steps from Problem #2 to determine the number of angelfish. Then they should add the fraction of angelfish to the fraction of goldfish (see Figure 12).
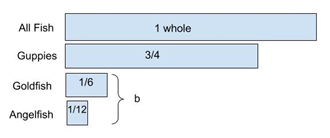
Figure 12: The tape diagram depicts the sum of goldfish and angelfish as the unknown, b


Again, it can be found in one step: the whole minus the guppies. I will again query students to see if any came up with this method. If someone did, but no one had done it with problem 2, I will revisit problem 2 and point out the possibility there.
Problem #4 How many more guppies are there than goldfish? Write the answer as a fraction. This is a one-step problem (see Figure 13). The tape diagram would be a comparison, and looks similar to bars on a bar graph, but in a horizontal position.
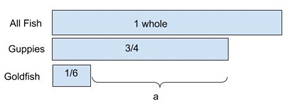
Figure 13: The tape diagram compares the fraction of goldfish to the fraction of guppies.


Problem #5:
As a fraction of the total, how many more guppies are there than angelfish?
The tape diagram (see Figure 14) shows how to represent the problem. This problem uses three steps. The first two steps, addition followed by subtraction, would have been done in Problem #1. Then third step is to subtract the fraction of angelfish from the fraction of guppies. Having worked with fourth graders for over two decades, I anticipate that some students will go through all the steps, instead of using the fraction of angelfish from Problem #1.
Figure 14: Tape diagram shows the third step which compares the fraction of angelfish to the fraction of guppies.
The solution is obtained by subtracting the fraction of angelfish from the fraction of guppies.

Problem #6:
As a fraction of the total, how many more guppies are there than goldfish or angelfish combined? Four steps are required to solve this problem. The first two steps follow problem #1 to determine the number of angelfish. Then the fraction of goldfish is added to the fraction of angelfish (see Figure 15). Or you could subtract guppies from the whole, leaving ¼ for goldfish and angelfish combined, then subtract the ¼ from ¾ to get 2/4 or ½. Once again, some students will go through all the steps even though they already found the number of goldfish or angelfish in Problem #3. By working in collaborative groups, some students will recognize the repetition, and show other students how to use the work they have already done in previous problems to save time.
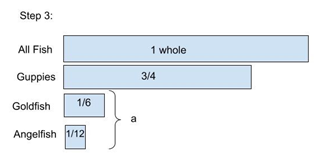
Figure 15: The tape diagram shows the third step which combines the fraction of angelfish and goldfish.
The final step is to subtract the combined amount of goldfish and angelfish from the fraction of guppies (see Figure 16).
Figure 16: The tape diagram shows the fourth step which compares the fraction of goldfish or angelfish to the fraction of guppies.

Some clever students might reason that, since guppies are ¾ of the fish, the others combined are 1/4, so the difference is ½. These problems should generate rich mathematical discourse as some students recognize that previous problems can be used to reduce the number of steps. Through student-to-student conversations, students will not only grapple with different ways to solve these problems, but also come to some conclusions about which ways are more efficient. The student discourse and ownership will be more powerful than if I stood in front of the class and led a discussion about the various ways to solve these problems.
Problem #7 is similar to Problem #6 and can involve up to four-steps. Problem #7: How many more guppies or angelfish combined are there than goldfish? The initial two steps are finding the fraction of angelfish (Problem #1). The third step (see Figure 17) would be to find the sum of guppies or angelfish (Problem #3). Students would add ¾ and 1/12, which would require that they find a common denominator. By multiplying the numerator and the denominator by 3, ¾ can be transformed into 9/12. The sum of 9/12 and 1/12 is equal to 10/12.
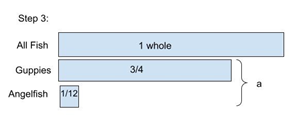
Figure 17: The tape diagram shows step 3 combining the fraction of guppies and angelfish.


The final step (see Figure 18) would be to subtract the fraction of goldfish from the fraction of guppies or angelfish. Again, this could be solved by subtracting 1/6 from 1, then subtracting 1/6 again. Students may recognize and add 1/6 to 1/6 then subtract 2/6 from 1. It will be interesting to see students develop more efficient ways to solve this problem after working through the previous problems. I suspect some will; in which case, they will demonstrate schema recognition and transfer to a novel problem!
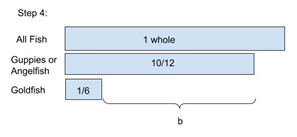
Figure 18: The tape diagram shows step 4, the difference between the fraction of goldfish and the fraction of guppies or angelfish.


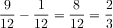
The equation 10/12 minus 1/6 has unlike denominators, so the students would have to find the common denominator between 6 and 12. Or they might reduce 10/12 to 5/6. It might be valuable for the teacher to ask, at a strategic time, to express all the fractions with a common denominator (of 12). The Least Common Denominator (LCM) is 12. The numerator and denominator in the fraction 1/6 can be multiplied by 2. So, 1/6 equals 2/12. Then 10/12 minus 2/12 equals 8/12. The fraction 8/12 can be simplified by finding the Greatest Common Factor between 8 and 12 which is 4. Then the numerator and the denominator are each divided by 4. The resulting fraction is 2/3 which is in simplest form. This can give students a lot of good practice with fractions.
Once the problems are solved, categorized, and shared, the students can sort the multi-step problems based on their operations (see Table 9).
|
Problem |
Operations |
Operations (fewer steps) |
|
#2 |
+; —; + |
— |
|
#3 |
+; —; + | — |
|
#5 |
+; —; — | — |
|
#6 |
+; —; +; — |
— |
|
#7 |
+; —; +; — |
—, — or +, — |
Table 9: The operations needed to solve Problems #2-7.
Comments: