Dimensional Analysis of Graphical Data: Ventricular Pressure vs. Volume Graph
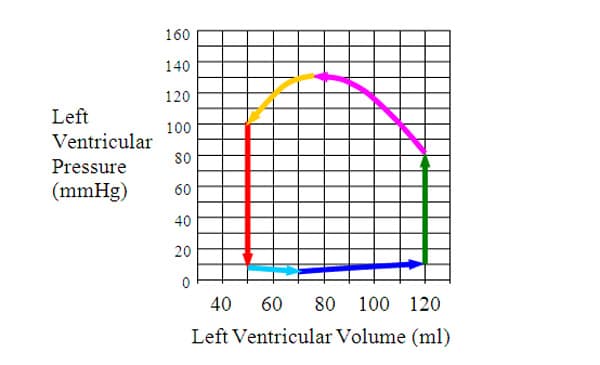
Figure 2 Left Ventricular Pressure vs. Volume Loop 7
The pressure vs. volume changes that occur in the left ventricle during one cardiac cycle are shown in Figure 2. This graph suggests several interesting questions about the ventricle's engineering characteristics. For context, the graph starts with the light blue arrow where the mitral valve opens allowing blood to flow into the ventricle which is relaxing in diastole. About midway through the dark blue arrow, the left atrium contracts increasing the pressure in the left ventricle slightly and pumping the remainder of its contents into the ventricle. At the green arrow, the ventricle begins contraction with the pressure increasing at a constant volume (i.e. isovolumetrically, since the valves guarding the entrance and exit to the ventricle are both closed). At the magenta arrow, the pressure in the ventricle exceeds the residual pressure in the aorta, the aortic valve opens, and blood is pushed out of the ventricle into the aorta. At the orange arrow, blood continues flowing out of the ventricle until the aortic pressure exceeds the ventricle pressure and the aortic valve closes. At the red arrow, the ventricle begins diastole and experiences isovolumetric relaxation until the pressure falls below the atrial pressure and the mitral valve opens again for another cycle. In addition to the pressure and volume directly shown in the graph, it is clear that the process of moving blood from the ventricle to the aorta requires energy for the heart to do this work.
Analysis 1: Area Enclosed by a Curve
Frequently, the area enclosed by a curve will have significance. Mathematically, the process of finding the area within a curve is the operation of integration. I can approximate the integration suggested by this graph with an estimate of graphical area. Each of the rectangles in the graph has a base that is measured in units of volume and a height that is measured in units of pressure. I can do a pre-analysis of the units that this area represents in the graph by using the SI units for pressure and volume and simplifying.
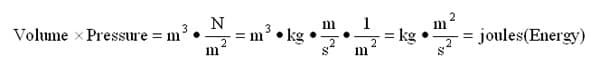
Since the quick dimensional calculation yields an energy unit, a quantity known to have engineering significance, I know that this is a calculation worth making in detail.
Counting boxes and taking into account fractions of boxes, I arrived at a total of about 78 boxes enclosed by the loop of colored arrows in Figure 1. Each box has a base of 10ml and a height of 10 mmHg so that the area of each box is 10 ml•10 mmHg = 100 ml•mmHg.

One joule is approximately equivalent to the amount of work I would do lifting a 1 kg mass by 10 cm. If I assume in this case a heart rate of 60 bpm, meaning one cardiac cycle occurring every second, then the left ventricle power output is 1 J/1 sec=1 watt. Taking into account that there are three other chambers of the heart beating, albeit with much less power, I can estimate a total power requirement around 2 watts or less. I could, of course, get a better estimate if I had PV graphs of all of the chambers.
The previous calculation, however, is only the net amount of work that the ventricle does on the blood. The blood entering and leaving the ventricle has a velocity and hence a kinetic energy. The difference between the maximum volume and the minimum volume is the stroke volume of blood pumped in the cycle. I can read this from the graph as 120 ml – 50 ml = 70 ml stroke volume. The blood is ejected from the heart into the aorta with an average velocity of 63 cm/sec. 8 Blood has a density of 1060 kg/m 3 so the kinetic energy of the ejected blood is:
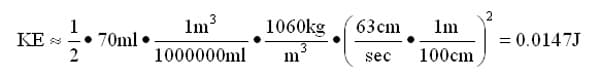
This kinetic energy is considerably smaller than the energy that I calculated for the work done on the blood during the cardiac cycle, and is probably less than the error in calculating that larger energy.
I should point out an important calculation technique that is frequently used when trying to get the big picture of a situation without going into excessive detail before it is needed. Because I used 60 bpm, which I intuitively understand to produce 1 beat/sec, I could do a quick conversion in my head from joules to watts for this choice of parameters. Frequently, when I want a ballpark estimate I will strategically pick input data values to facilitate quick calculation without a calculator. Had I chosen to use my grandfather's assumed heart rate of 70 bpm, I would make the following calculation for cardiac output power explicitly involving dimensional analysis

While this calculation isn't difficult, it is more challenging than the one at 60 bpm. I do note that with the higher heart rate, the power requirements are slightly higher. I also can note the structure of the conversion more clearly here and infer how the output will scale with increased heart rate. For example, with a heart rate of 180 bpm during heavy exercise, I estimate 3W of power to drive the left ventricle since 180 bpm = 3 x 60 bpm. This estimate assumes that the pressure volume loop stays exactly the same under the dramatically different conditions, which is not true, but again I do get a starting point for a more detailed analysis.
Analysis 2: Slope of the Curve
The slope of a curve is also frequently a measure of engineering significance. In the case of the graph in Figure 2, the slope would be measured in units of
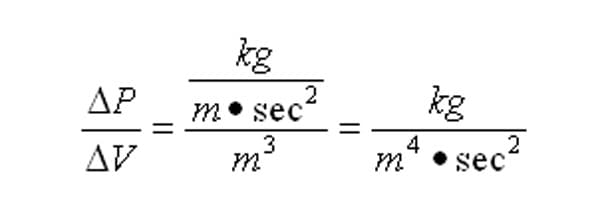
The quantity ΔP/ΔV is called the elastance. The reciprocal of the elastance is ΔV/ΔP and is called the compliance. 9 Compliance has SI units of m 4•sec 2/kg. (I note here that the reason that the slope of the graph gave the elastance rather than the compliance is that I chose to graph the volume on the horizontal axis and the pressure on the vertical axis in figure 2. Frequently when scientists study compliance, they plot the pressure on the horizontal axis and the volume on the vertical axis so that the slope of the graph is the compliance. This highlights the importance of noting which axis is which.)
The compliance of a blood vessel is a measure of how flexible (distensible) that blood vessel is in response to an increase in pressure. On the high pressure side of the circulatory system, an artery's ability to flex helps it perform its job better. In fact, as adults age, the compliance of their arteries decreases dramatically. A typical compliance for an adult age 20 to 39 is about 0.75 ml/mmHg compared to a typical compliance for an adult age 60 to79 of about 0.38 ml/mmHg. 1 0 The compliance of arteries is an important characteristic that artificial arteries need to mimic.
I will do a calculation of the compliance shown in the left ventricle during the part of the cycle where the aortic valve opens along the magenta arrow in Figure 2. Using points (V,P) starting at (120,80) and ending at (75,130), I calculate
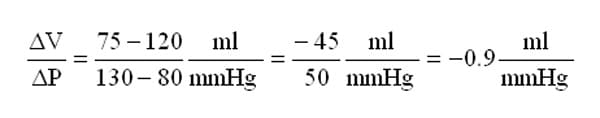
I notice the interesting fact that this calculation gives a negative value for the compliance of the left ventricle during this part of the cardiac cycle as opposed to the positive values of compliance stated for the arteries. This sign difference is a result of what the heart is doing versus what the artery is doing during this part of the cycle. The heart is decreasing its volume while it generates more pressure through contraction. The artery on the other hand is receiving pressurized blood and thus is expanding and increasing its volume in response to the heart pumping.
Comments: