Dimensional Analysis does Problem Analysis
Using dimensional analysis as a problem analysis tool involves understanding what type of quantity is involved in a situation (for example, energy or pressure or time) and using the units of the relevant quantities to cast light on how the measured input data might interact mathematically to frame the problem in the relevant units.
Blood pressure measurement is a non-invasive means of assessing the overall health of the circulatory system. I have a blood pressure monitor that measures systolic and diastolic pressure at the wrist from the radial artery rather than on the upper arm. The wrist location allows me to measure my blood pressure in a variety of positions.
I took my blood pressure in three positions: 1) standard arm at the side, 2) wrist raised 30 inches above the standard, and 3) wrist lowered 12 inches below standard.
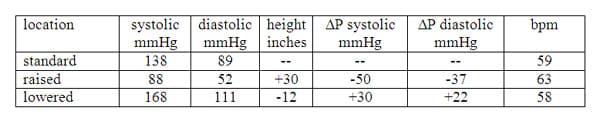
The data raise many questions, including why the blood pressure measurement changes with my arm in different positions. This tendency for the blood pressure to vary based on position poses another hurdle for the artificial organ developer. At first it might appear that altitude changes blood pressure, but I have had my blood pressure taken on different floors of the hospital without seeing any significant change.
In this problem, dimensional analysis can help me understand these measurements. When I raised my arm 30 inches up from the standard position, I did work on the blood in my wrist. As discussed in the Derived Units section on energy, that blood now has greater potential energy; potential energy was increased by m•g•h, where m is the mass of the blood, g is the acceleration due to gravity, and h = 30 inches is the height I raised the blood. I learned in the left ventricle problem above that pressure•volume is also a form of energy. With these two observations, I now have the height and the pressure expressed in the same language. Compared with the standard position whose energy is P•V, the raised position has both a P•V component and a potential energy component. Assuming that the volume of blood in the radial artery is the same for both systolic measurements, I can write an energy equation.
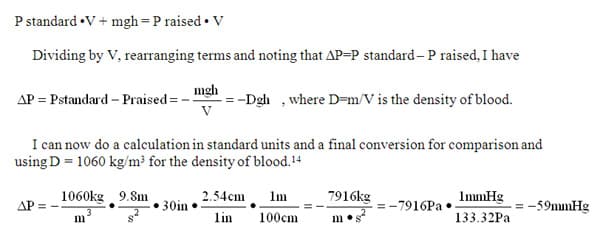
The -59 mmHg calculated is reasonably close to the -50 mmHg measured. The difference between the calculation and the measurement could be caused by my systemic blood pressure changing between measurements, my arteries changing diameter to compensate for the lower pressure, error in the measurement or something else. Nevertheless dimensional analysis leads me to a remarkably simple explanation for the pressure difference that agrees remarkably well with experiment.
Comments: