Relations
A relation is a rule that relates one kind of thing to another. The first kind of thing is often called an input, and the collection of all possible inputs is the domain of the relation. The second kind of thing is called an output, and the all the possible outputs belong to a set called the range of the relation. If the output b is related to the input a by the relation R, we write aRb. In principle, to describe a relation, we could just list each pair (a, b) such that aRb. The collection of all pairs (a, b) such that aRb is called the graph of R.
Most relations that we study in high school are numerical: the domain and the range are sets of numbers, and the relation is usually described by a formula. When the domain and range of R consist of real numbers, we can represent the graph of R as a collection of points in the (x, y)–plane. This gives us a geometrical picture of R. We also call this picture the graph of R.
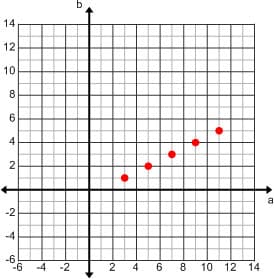
For example, suppose the domain A = {3, 5, 7, 9, 11}, the range B = {1, 2, 3, 4, 5} and the relation R is aRb if b = (a 1)/2. Then the graph G R of R consists of the pairs
G R= {(3, 1), (5, 2), (7, 3), (9, 4), (11, 5)}
Now if we plot these pairs on a coordinate grid, we get the following picture for G R.
A relation can also be described using what is called a "Mapping Diagram." Here is a mapping diagram for the relation R defined above.
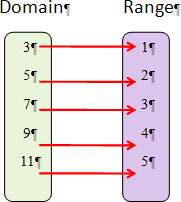
Mapping diagrams are very useful when a student is trying to understand the concept of functions in comparison with relations. While in relations, input values could be repeated for the values of the outputs, in functions, this repetition is not admitted.
Comments: