Inverse Relations and Inverse Functions
In general, if a relation R pairs elements a from a domain with elements b from a range, the inverse relation R - 1 pairs elements b with elements a. That is bR - 1a exactly when aRb. That is, if (a, b) is an ordered pair of the relation R, then (b, a) is an ordered pair of R - 1. This means that the graph of R - 1 is gotten from the graph of R simply by interchanging the x and y coordinates. The mapping
S: (x, y) → (y, x)
of the plane converts the graph of any relation R to the graph of the inverse relation R - 1.
It is easy to see that the mapping S leaves points (x, x) on the diagonal line fixed. In fact, as we will show later, geometrically, S is a reflection across the diagonal line. The pictures below illustrate the relation between the graph of a relation (in blue) and the graph of the inverse relation (in red). In both examples, the original relation is a function. In the first example, the inverse relation (in red color) is also a function, but in the second example, it is not, since the graph clearly does not pass the vertical line test.
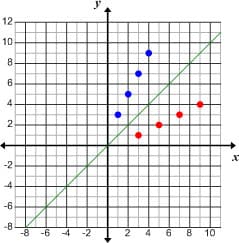
The blue points above the line y = x represent a relation; while the red points below the line y = x represent the inverse of the given relation.
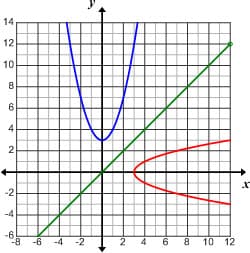
The blue graph above the line y =x represents the relation y = x 2 + 3; while the graph below the line y = x represents the inverse, x = y 2 + 3
Comments: